Figure 2.32 Daily chart of HDFC Bank
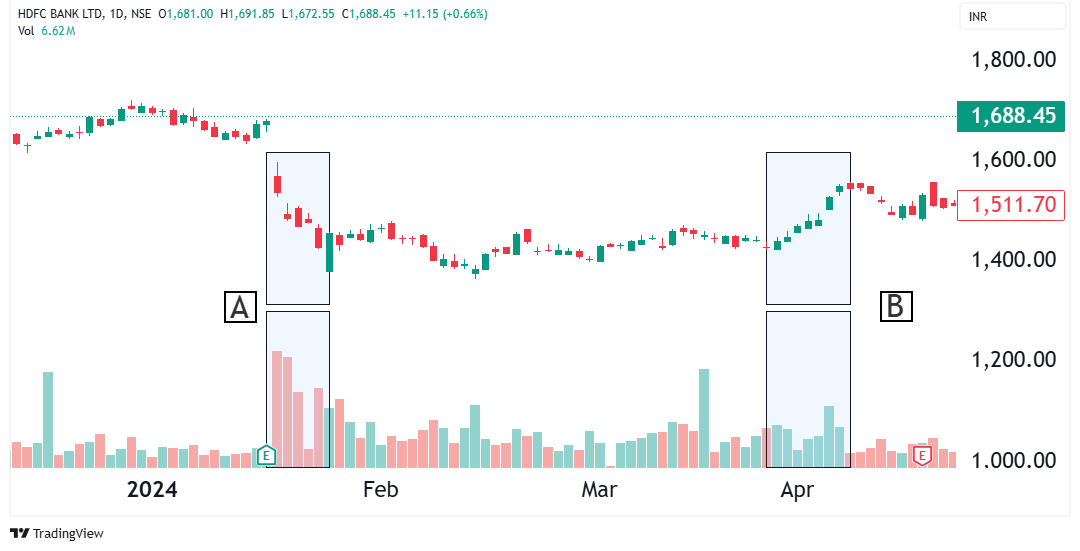
Figure 2.33 Daily chart of CESC Ltd
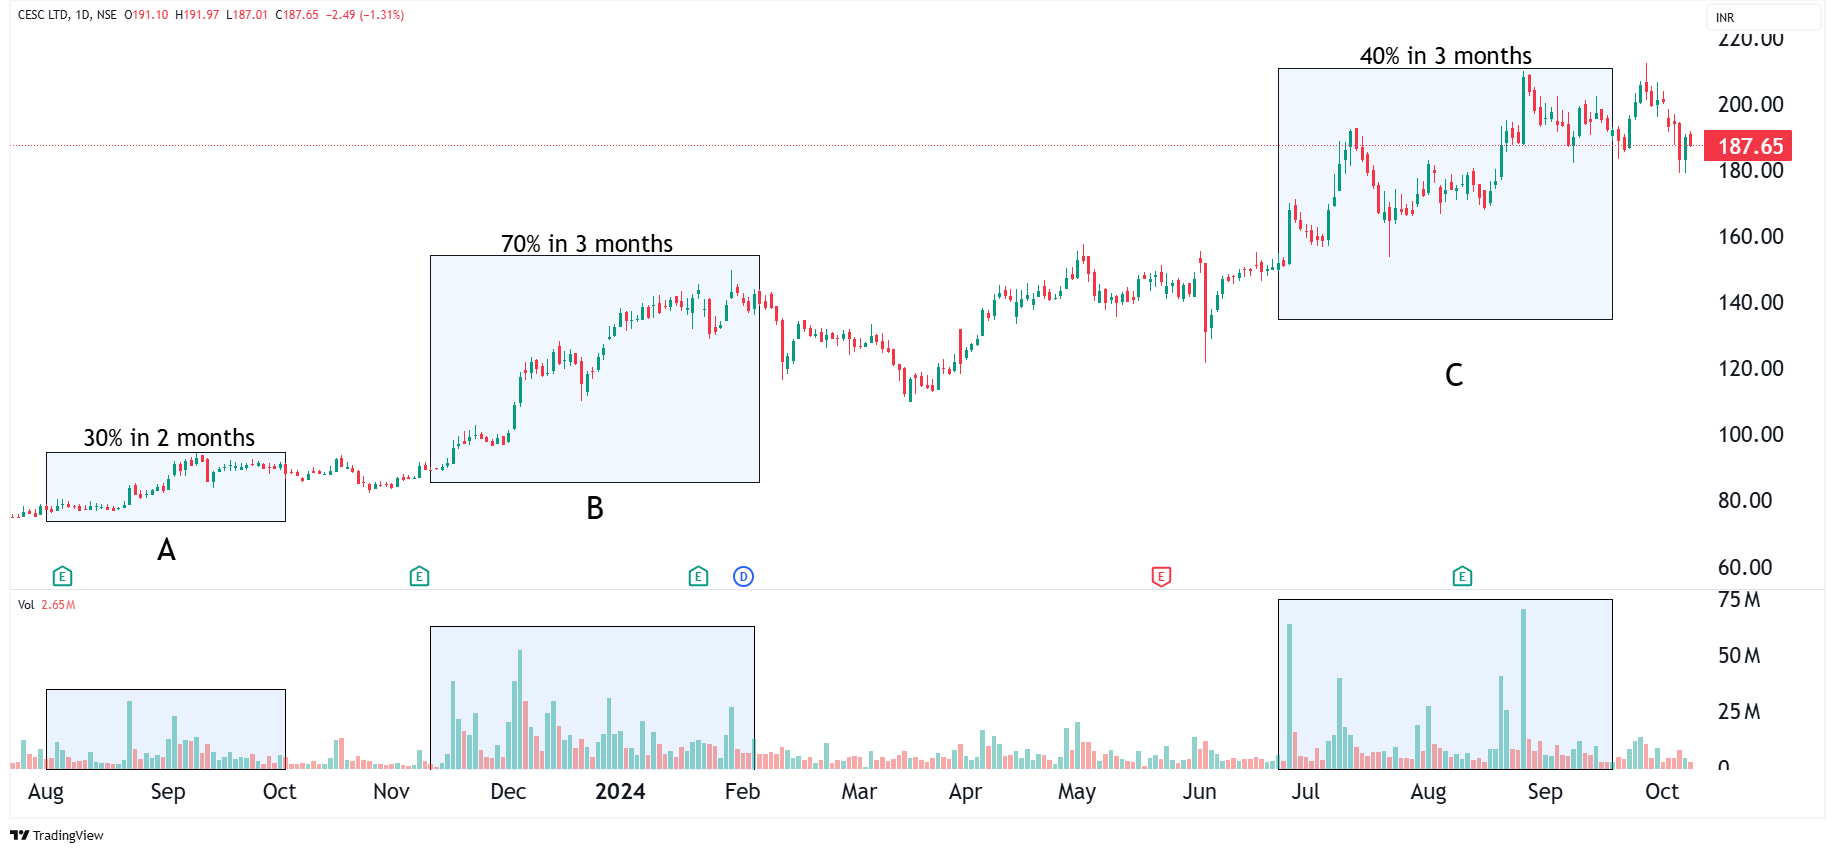
Figure 2.34 Delivery data of NHPC
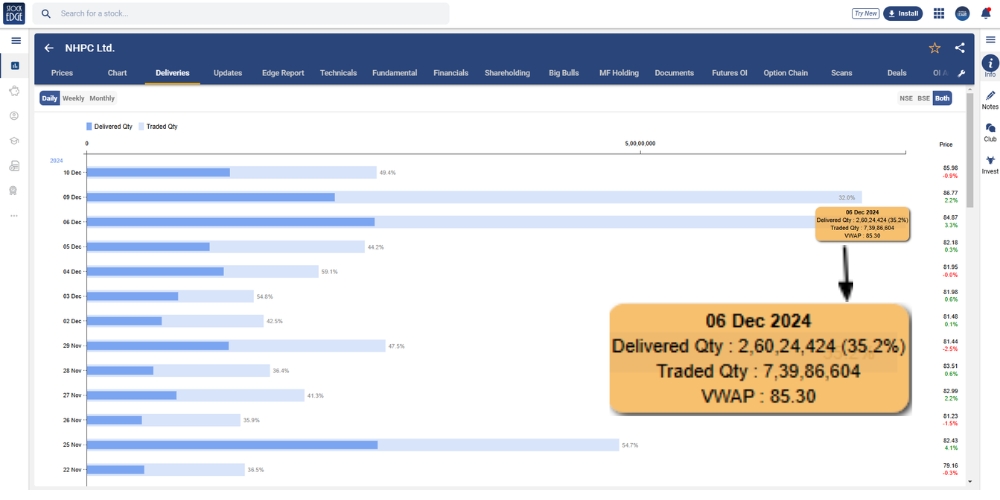
Figure 2.35 Intraday 15-minute chart of NHPC
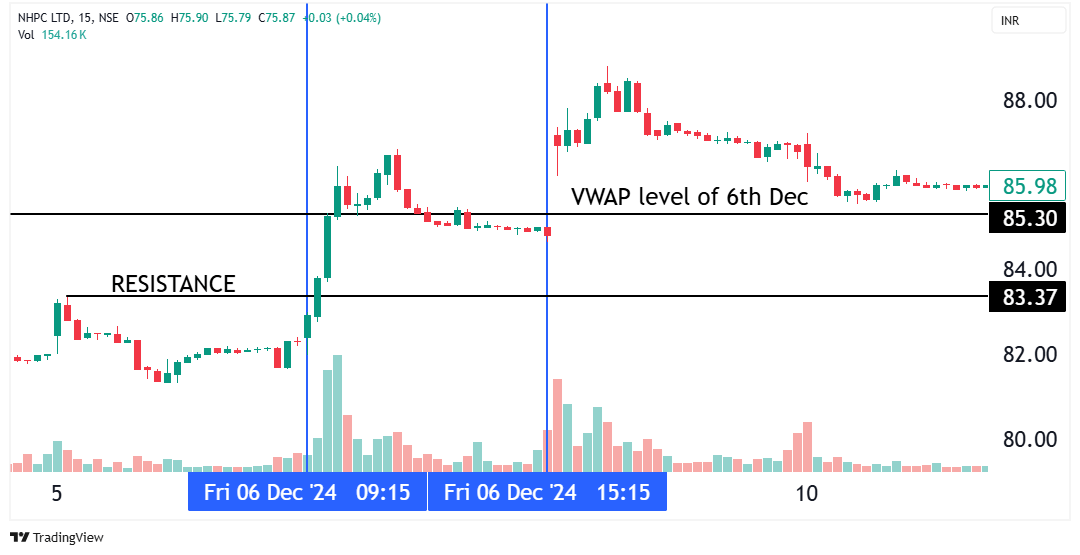
Figure 2.36 Daily chart of CESC Ltd
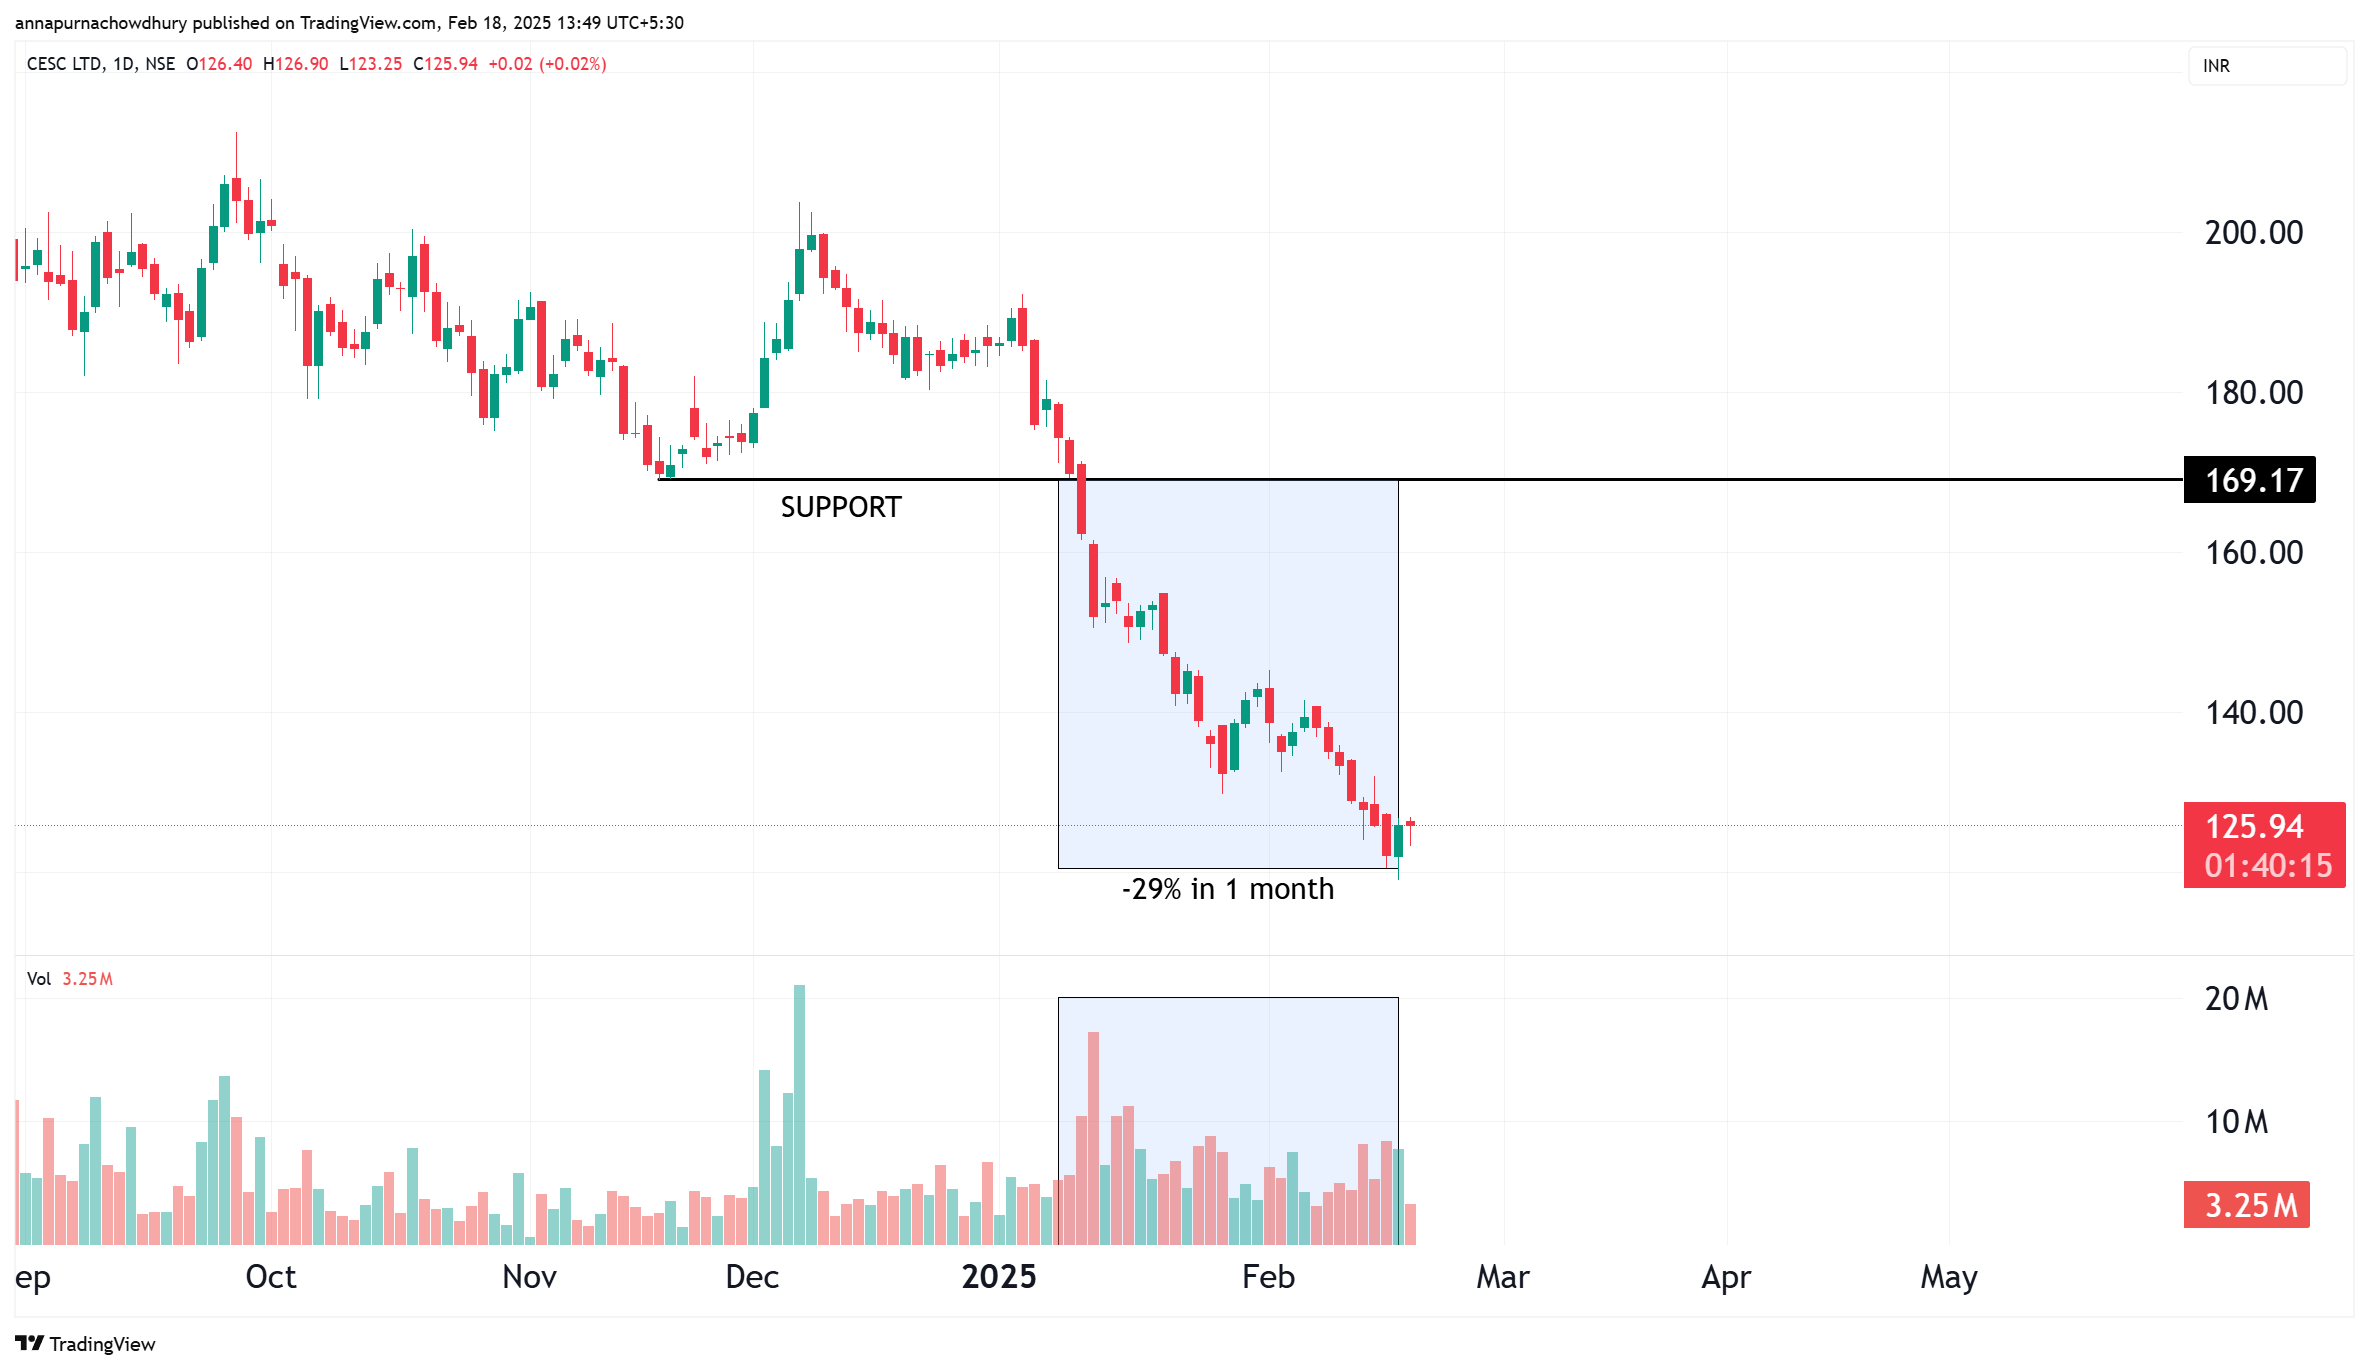
Figure 2.37 Volume and delivery scans in StockEdge
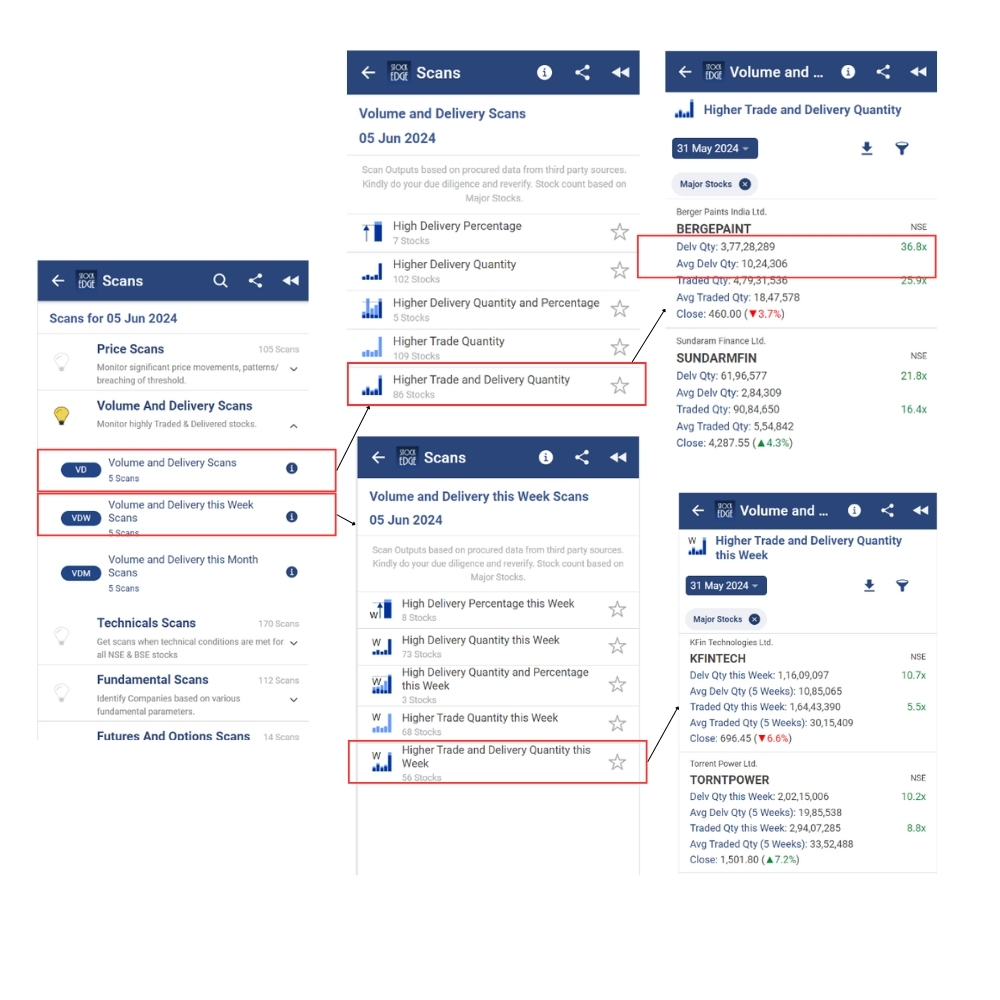
Figure 2.38 Daily chart of Sundaram Finance
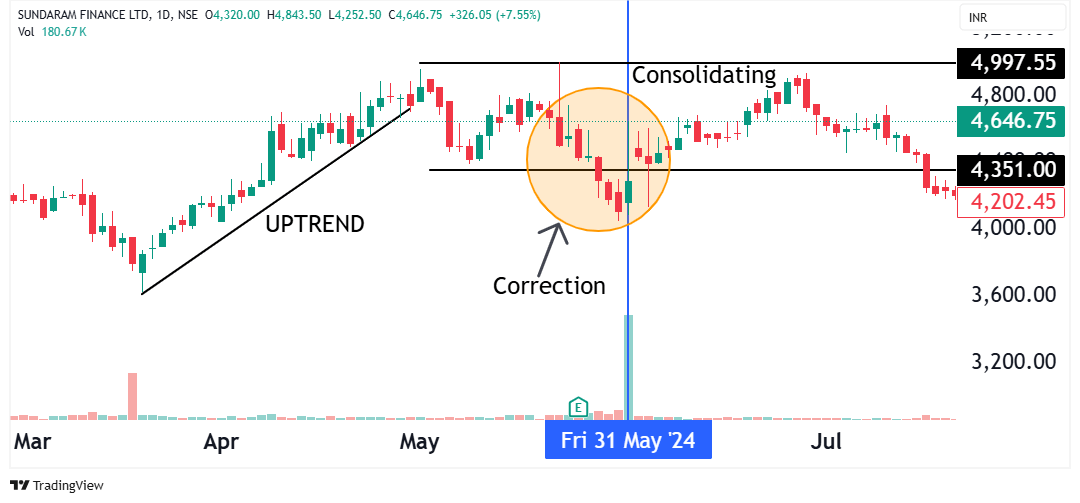
Figure 2.39 Daily chart of Torrent Power
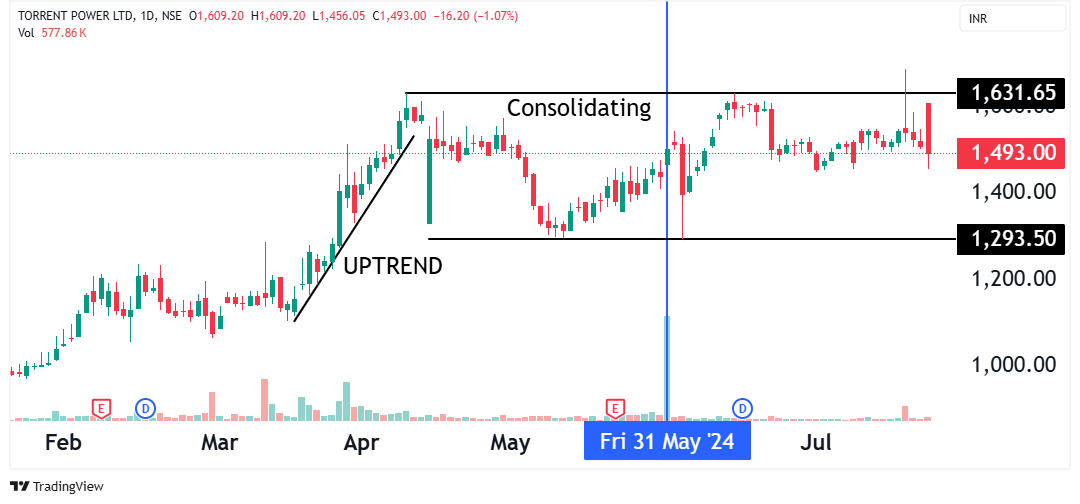
Figure 2.40
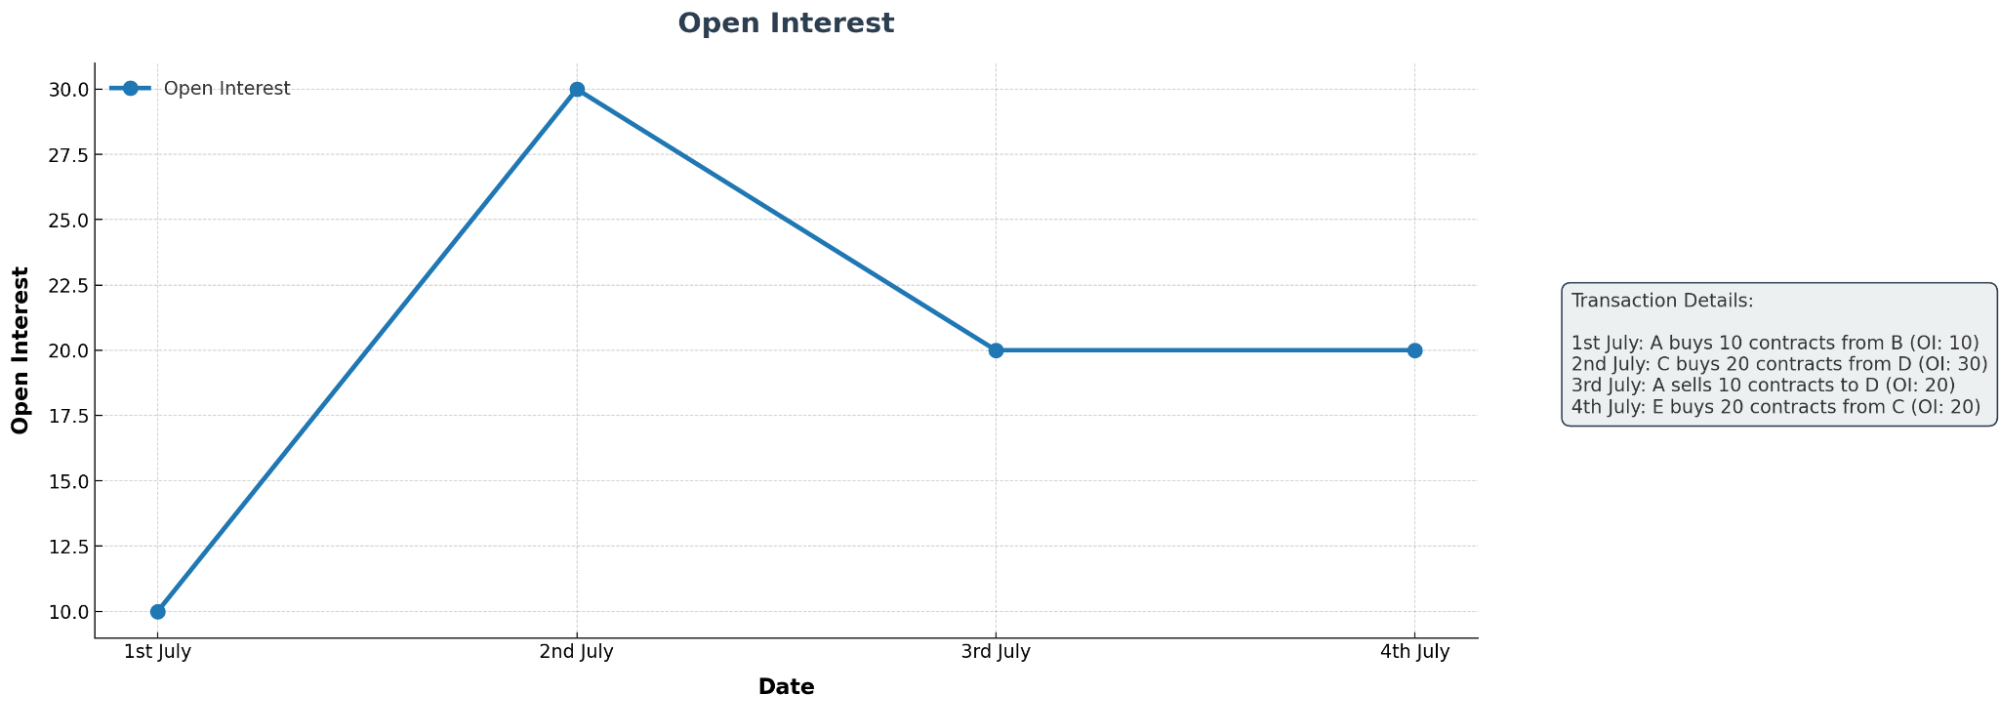
Figure 2.41 OI of SBI for the month of March 2023
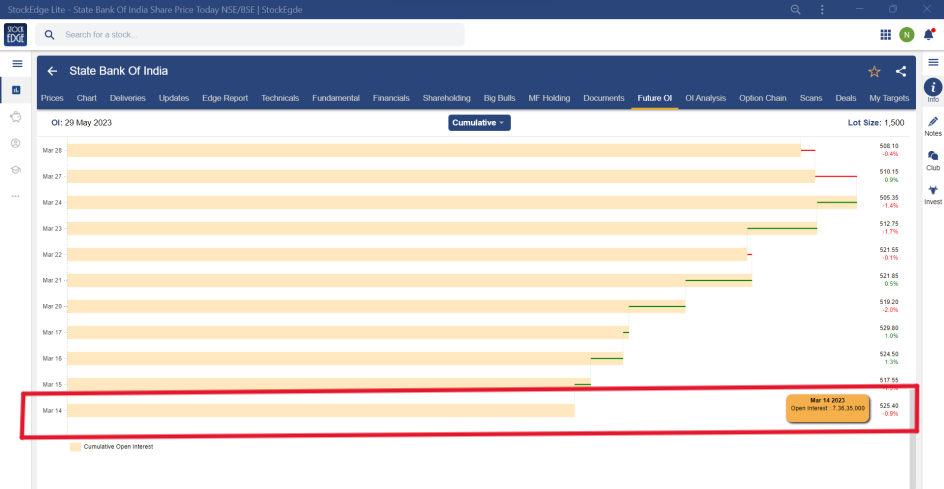
Figure 2.42 OI of State Bank of India for the month of May 2023
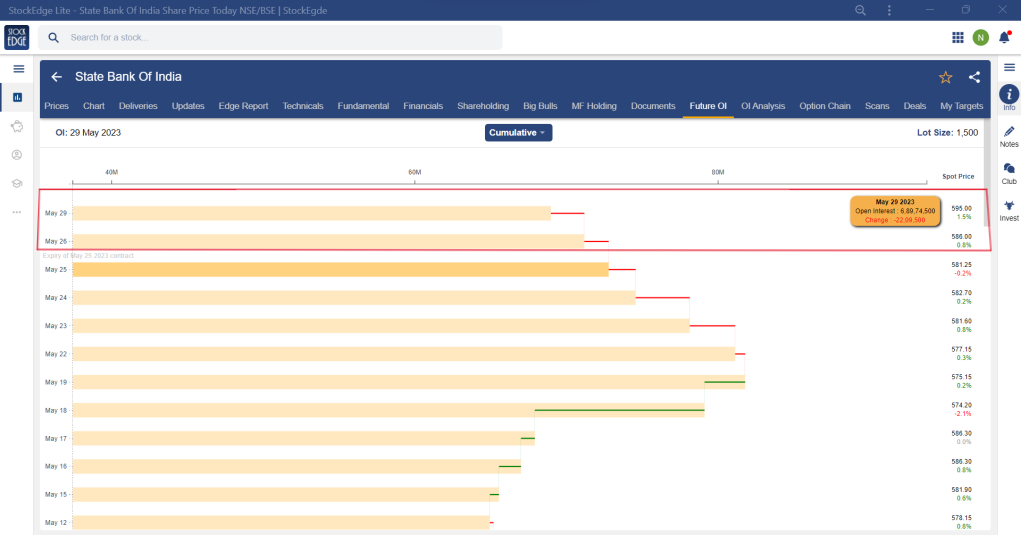
Figure 2.43 OI of State Bank of India for the month of May 2023
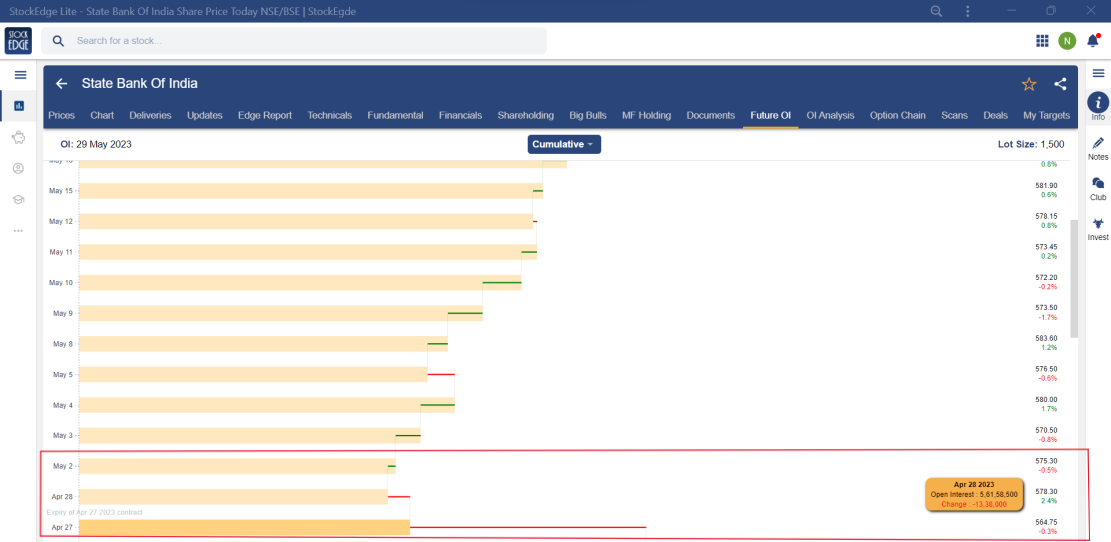
Figure 2.44 Interpretation of the change in OI along with price
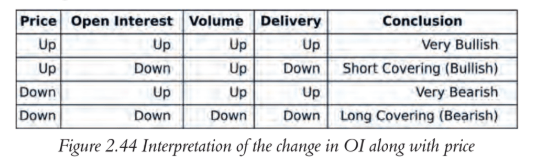
Figure 2.45 Daily chart of Dr Reddy
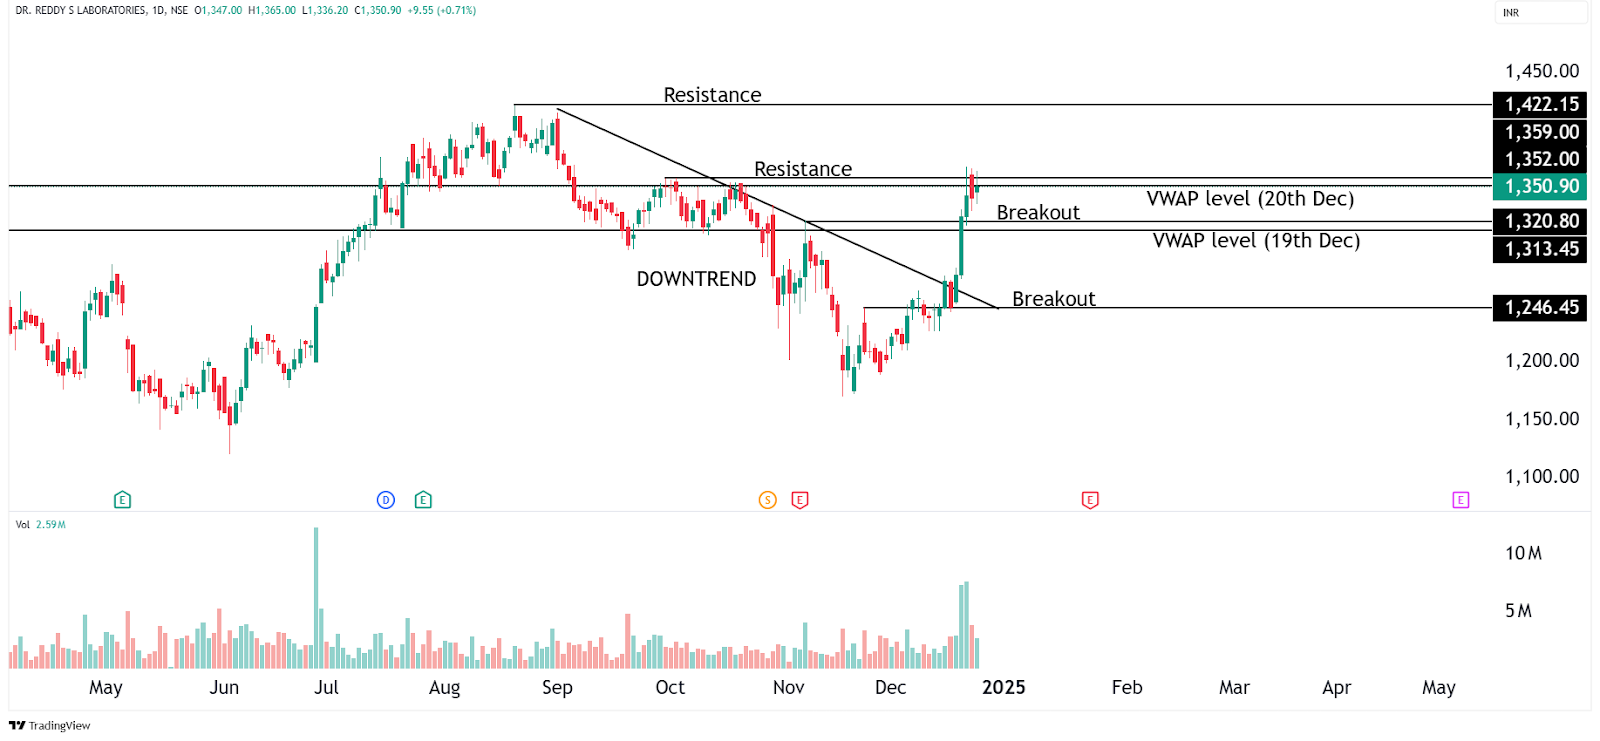
Figure 2.46 Delivery graph of Dr Reddy
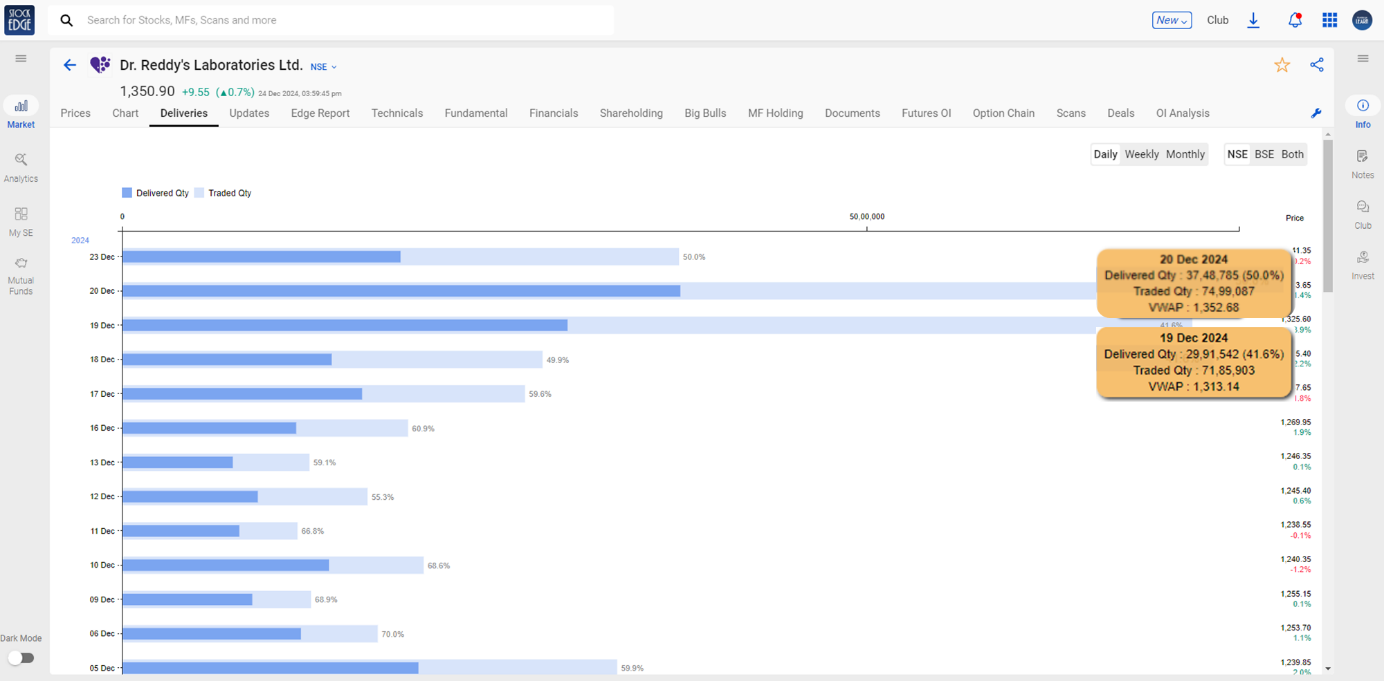
Figure 2.47 OI data of Dr Reddy
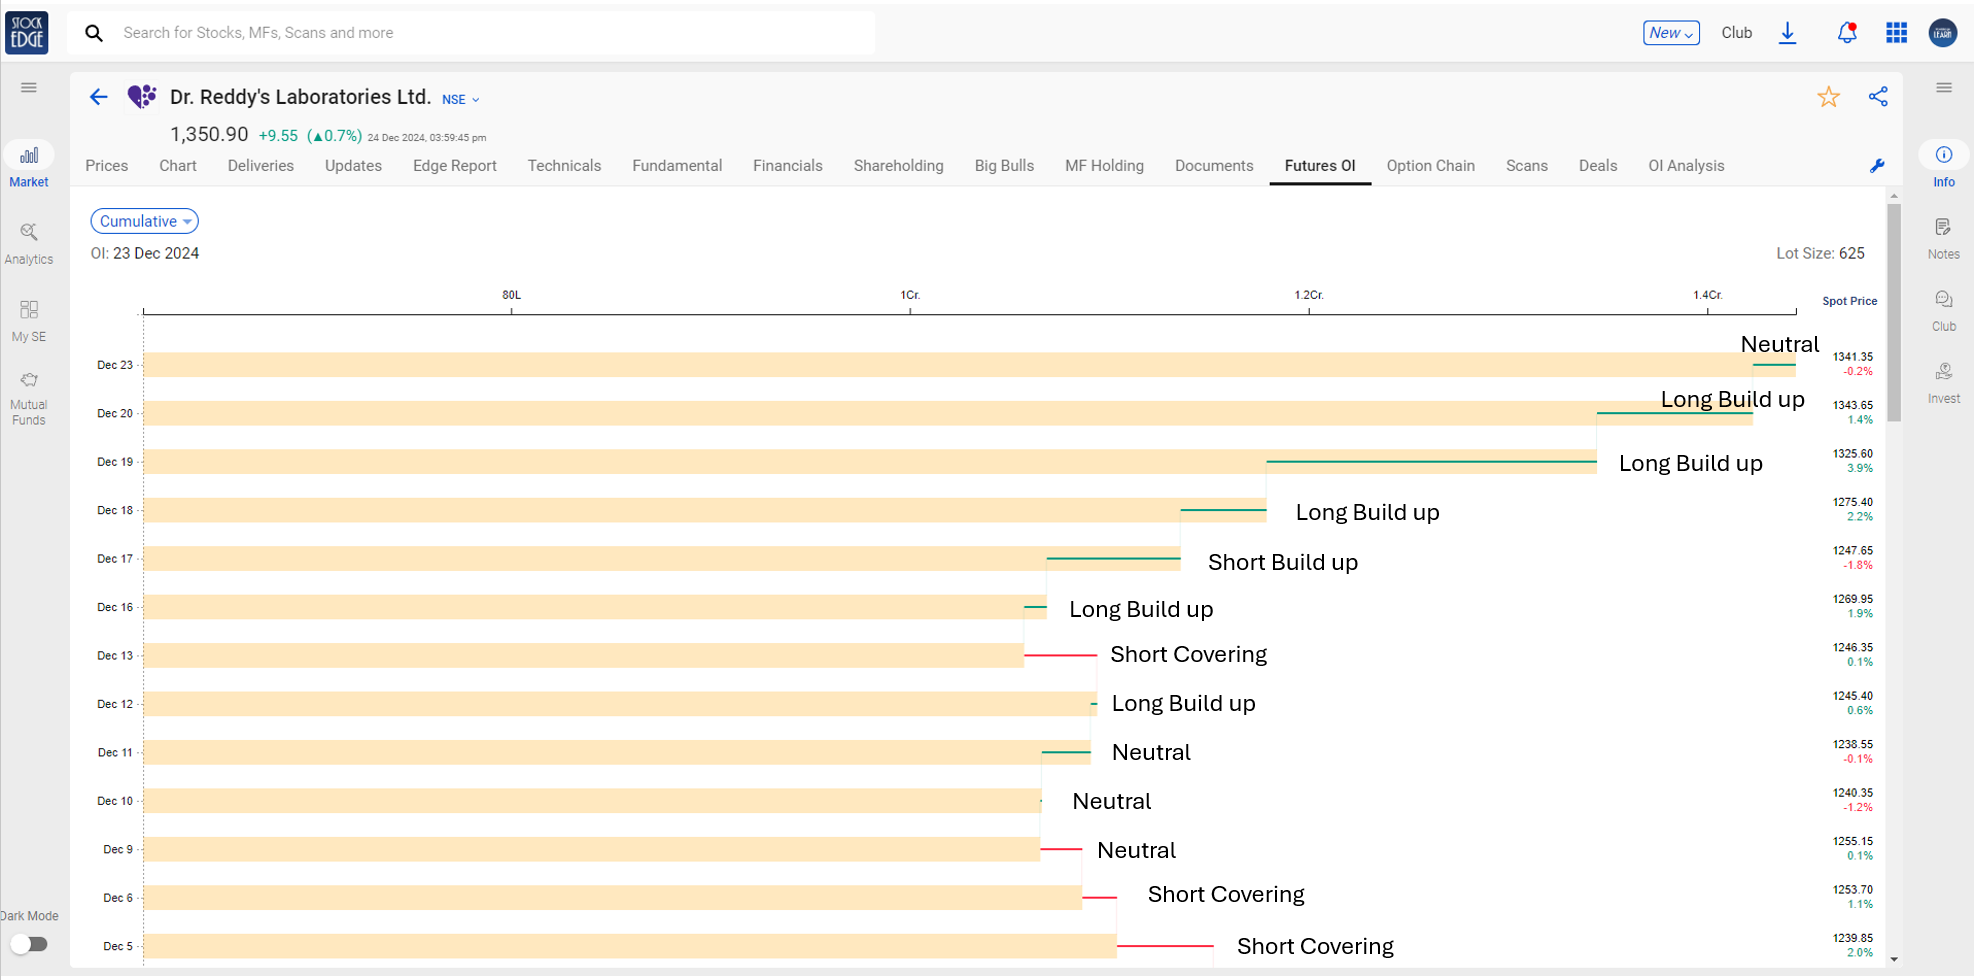
Table 2.3 StockEdge screenshot of the F&O zone
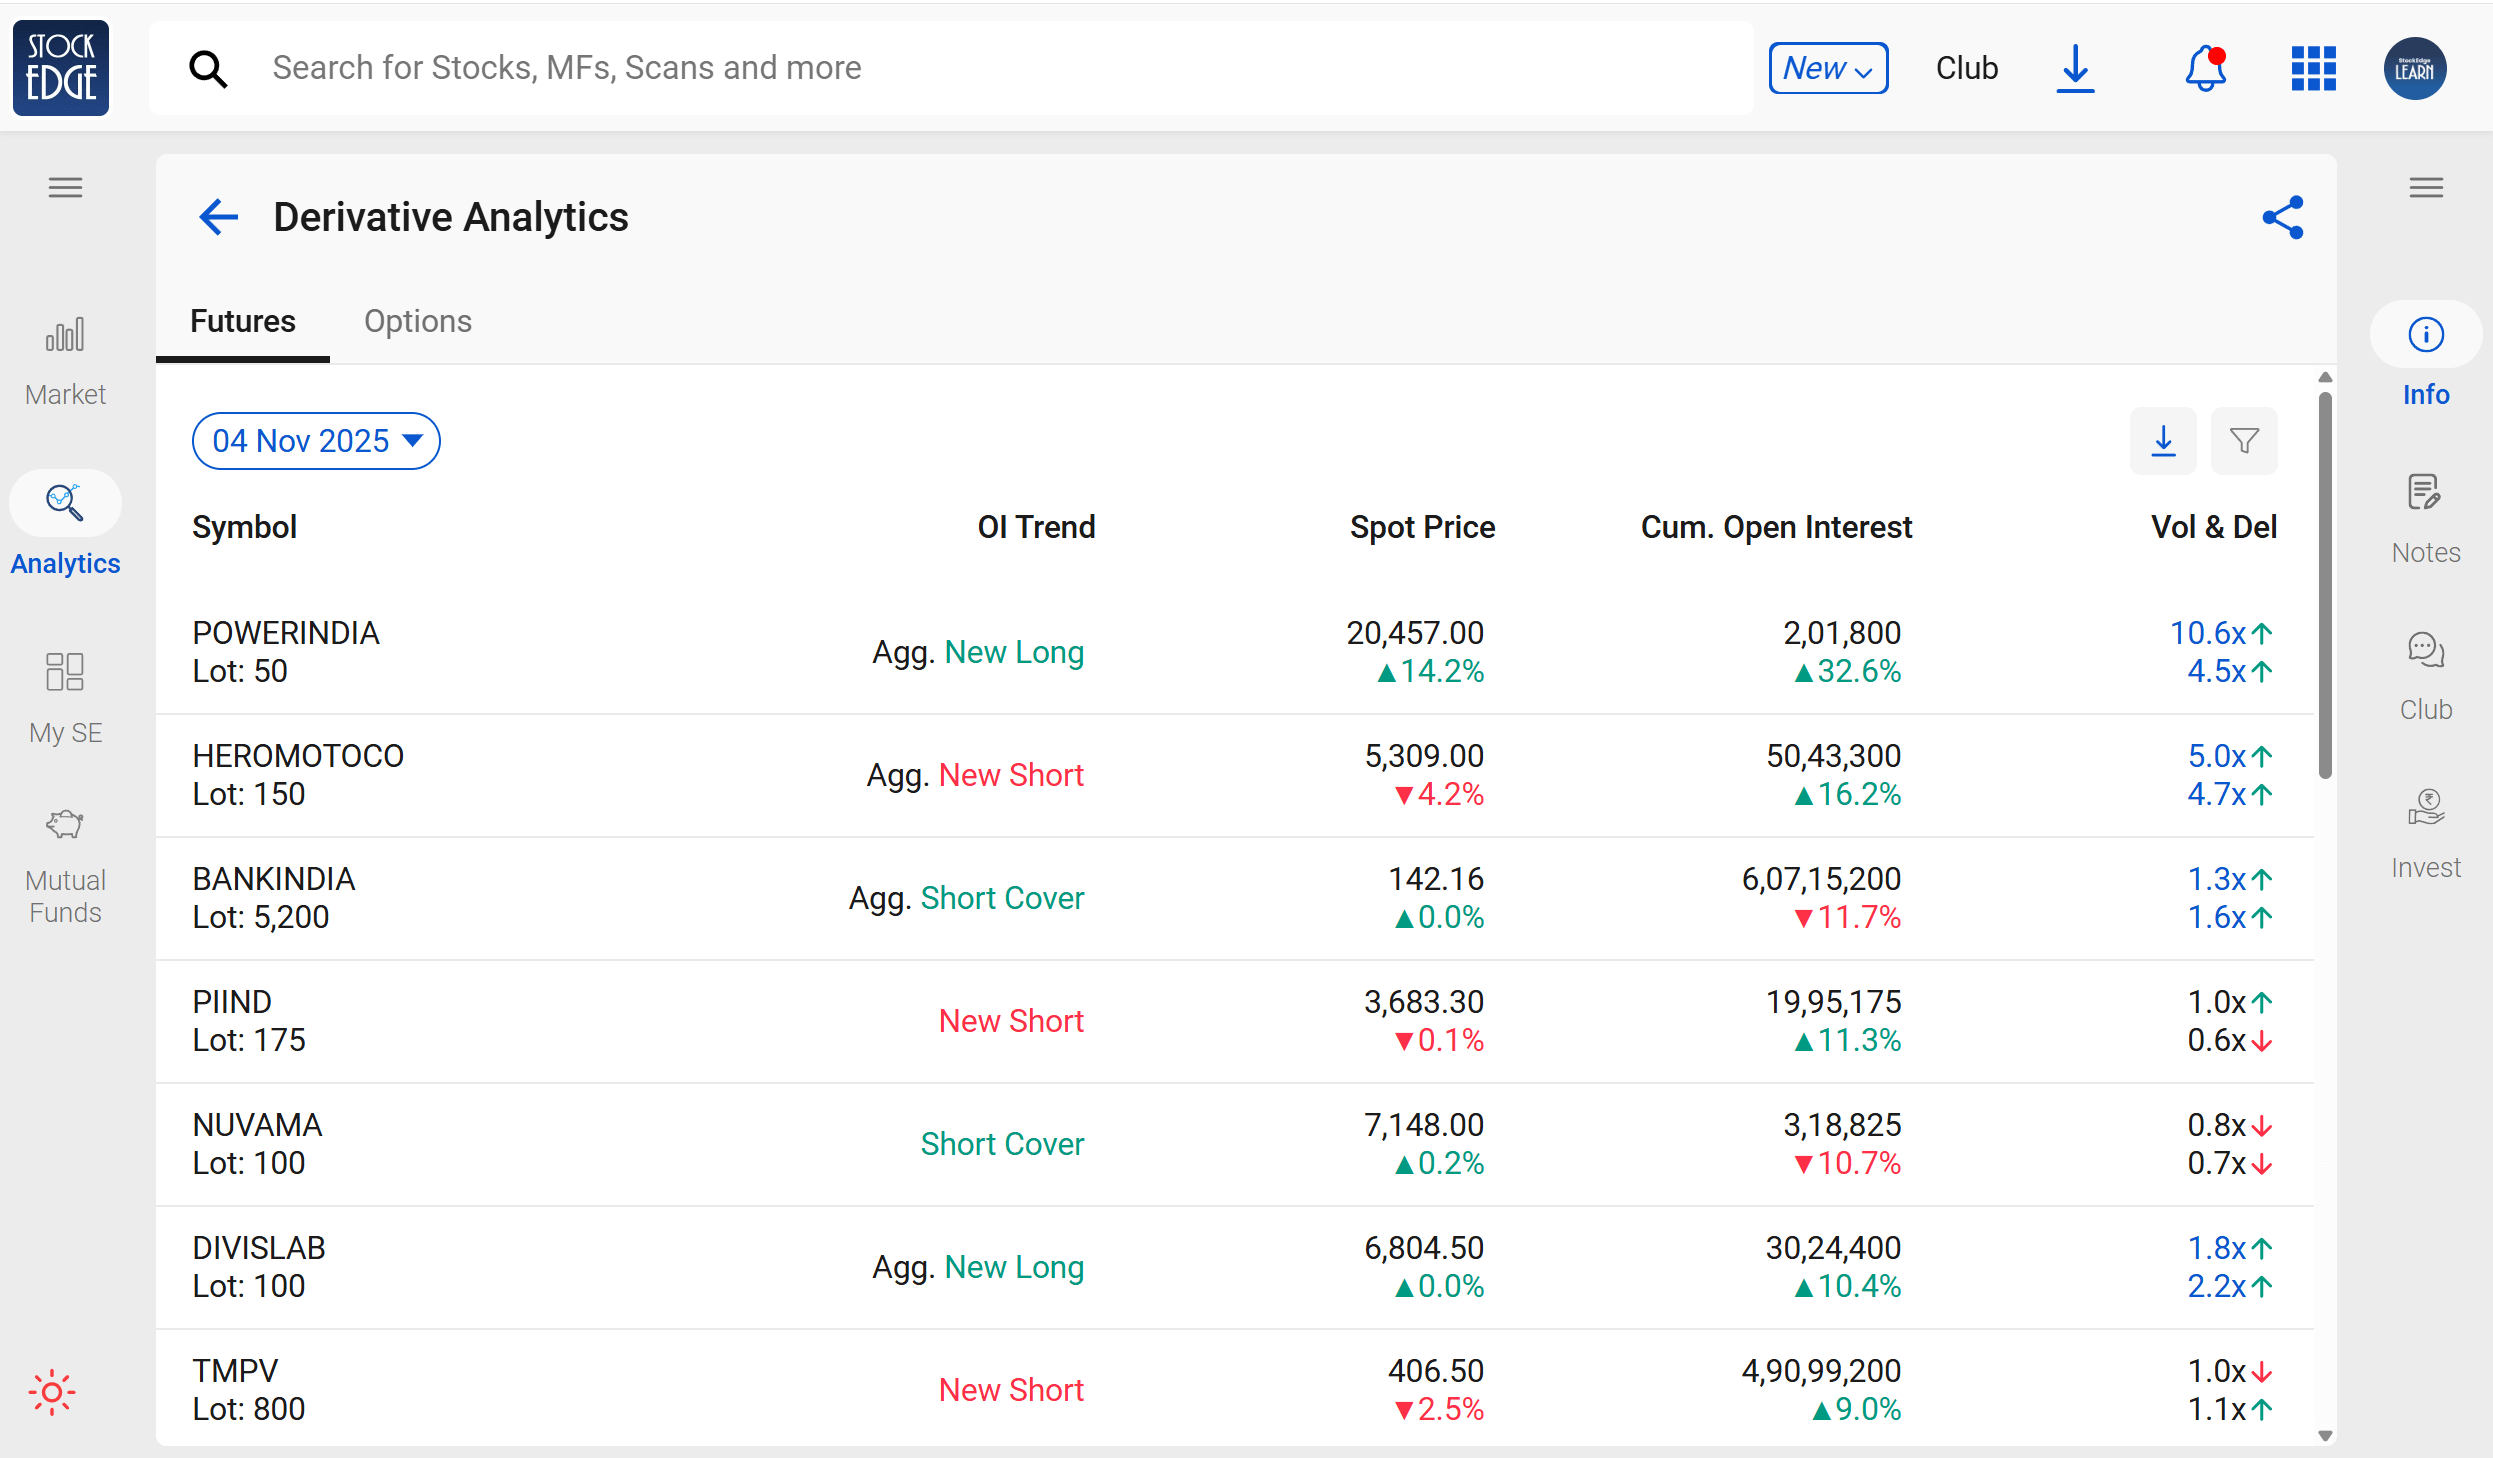
Figure 2.48
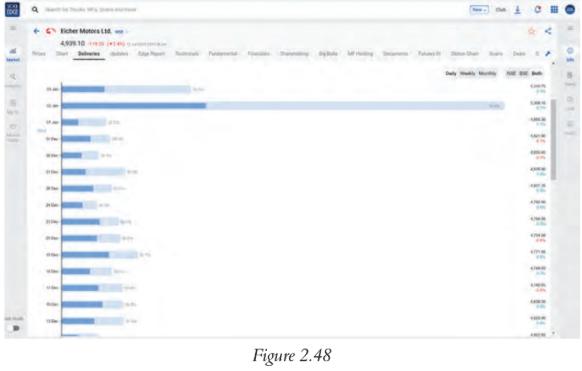
Figure 2.49
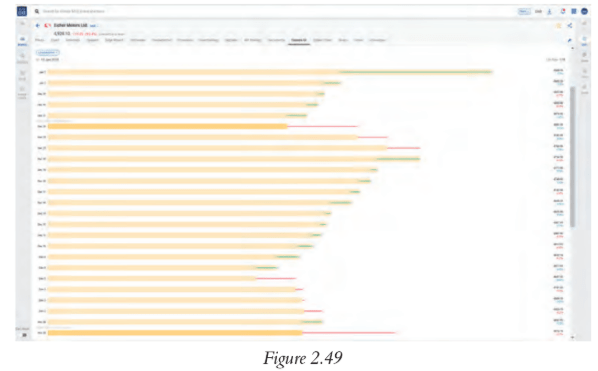
Figure 2.50
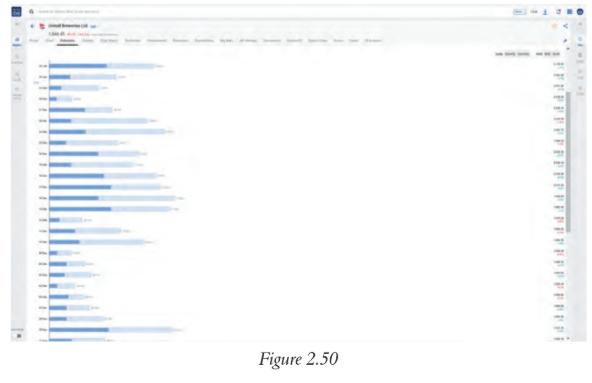
Figure 2.51
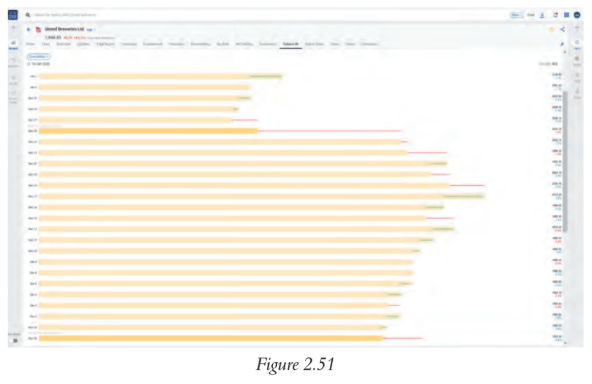
Figure 2.52
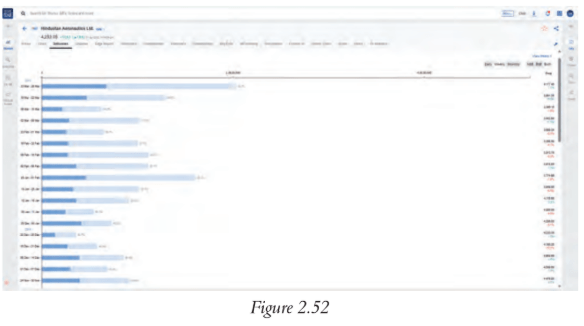
Figure 2.53
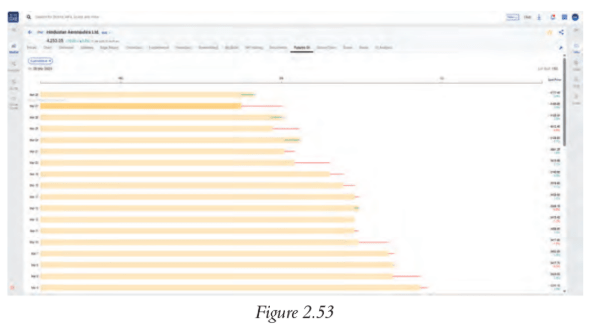
Figure 2.54
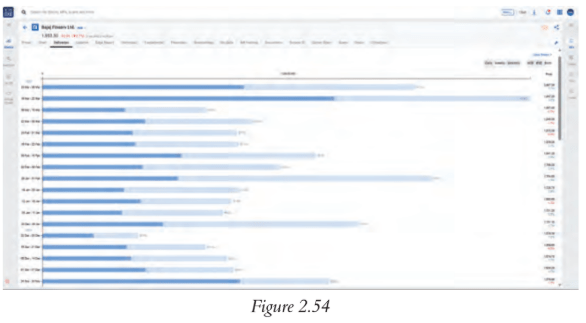
Figure 2.55
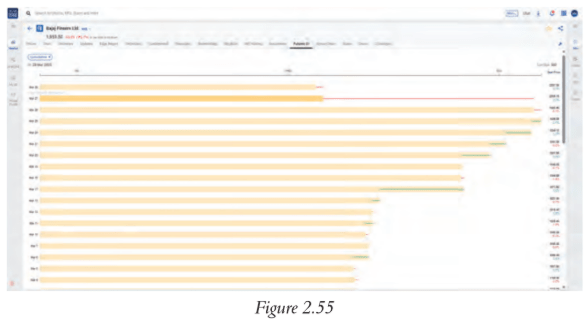
Figure 2.56
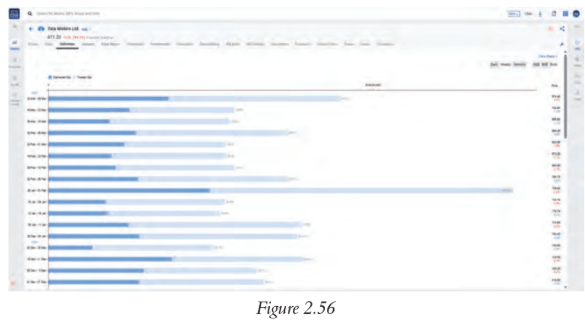
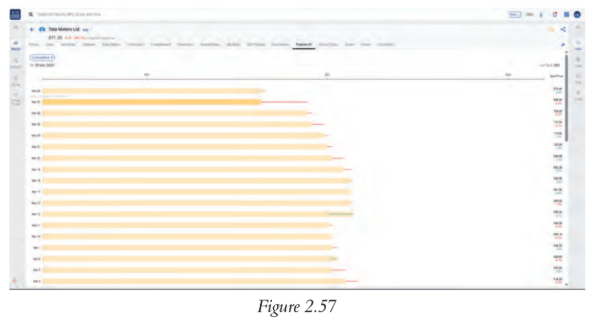
Figure 2.57
Playlist
2 Videos

35:38