Fig 3.1 Moving average indicators listed in TradingView
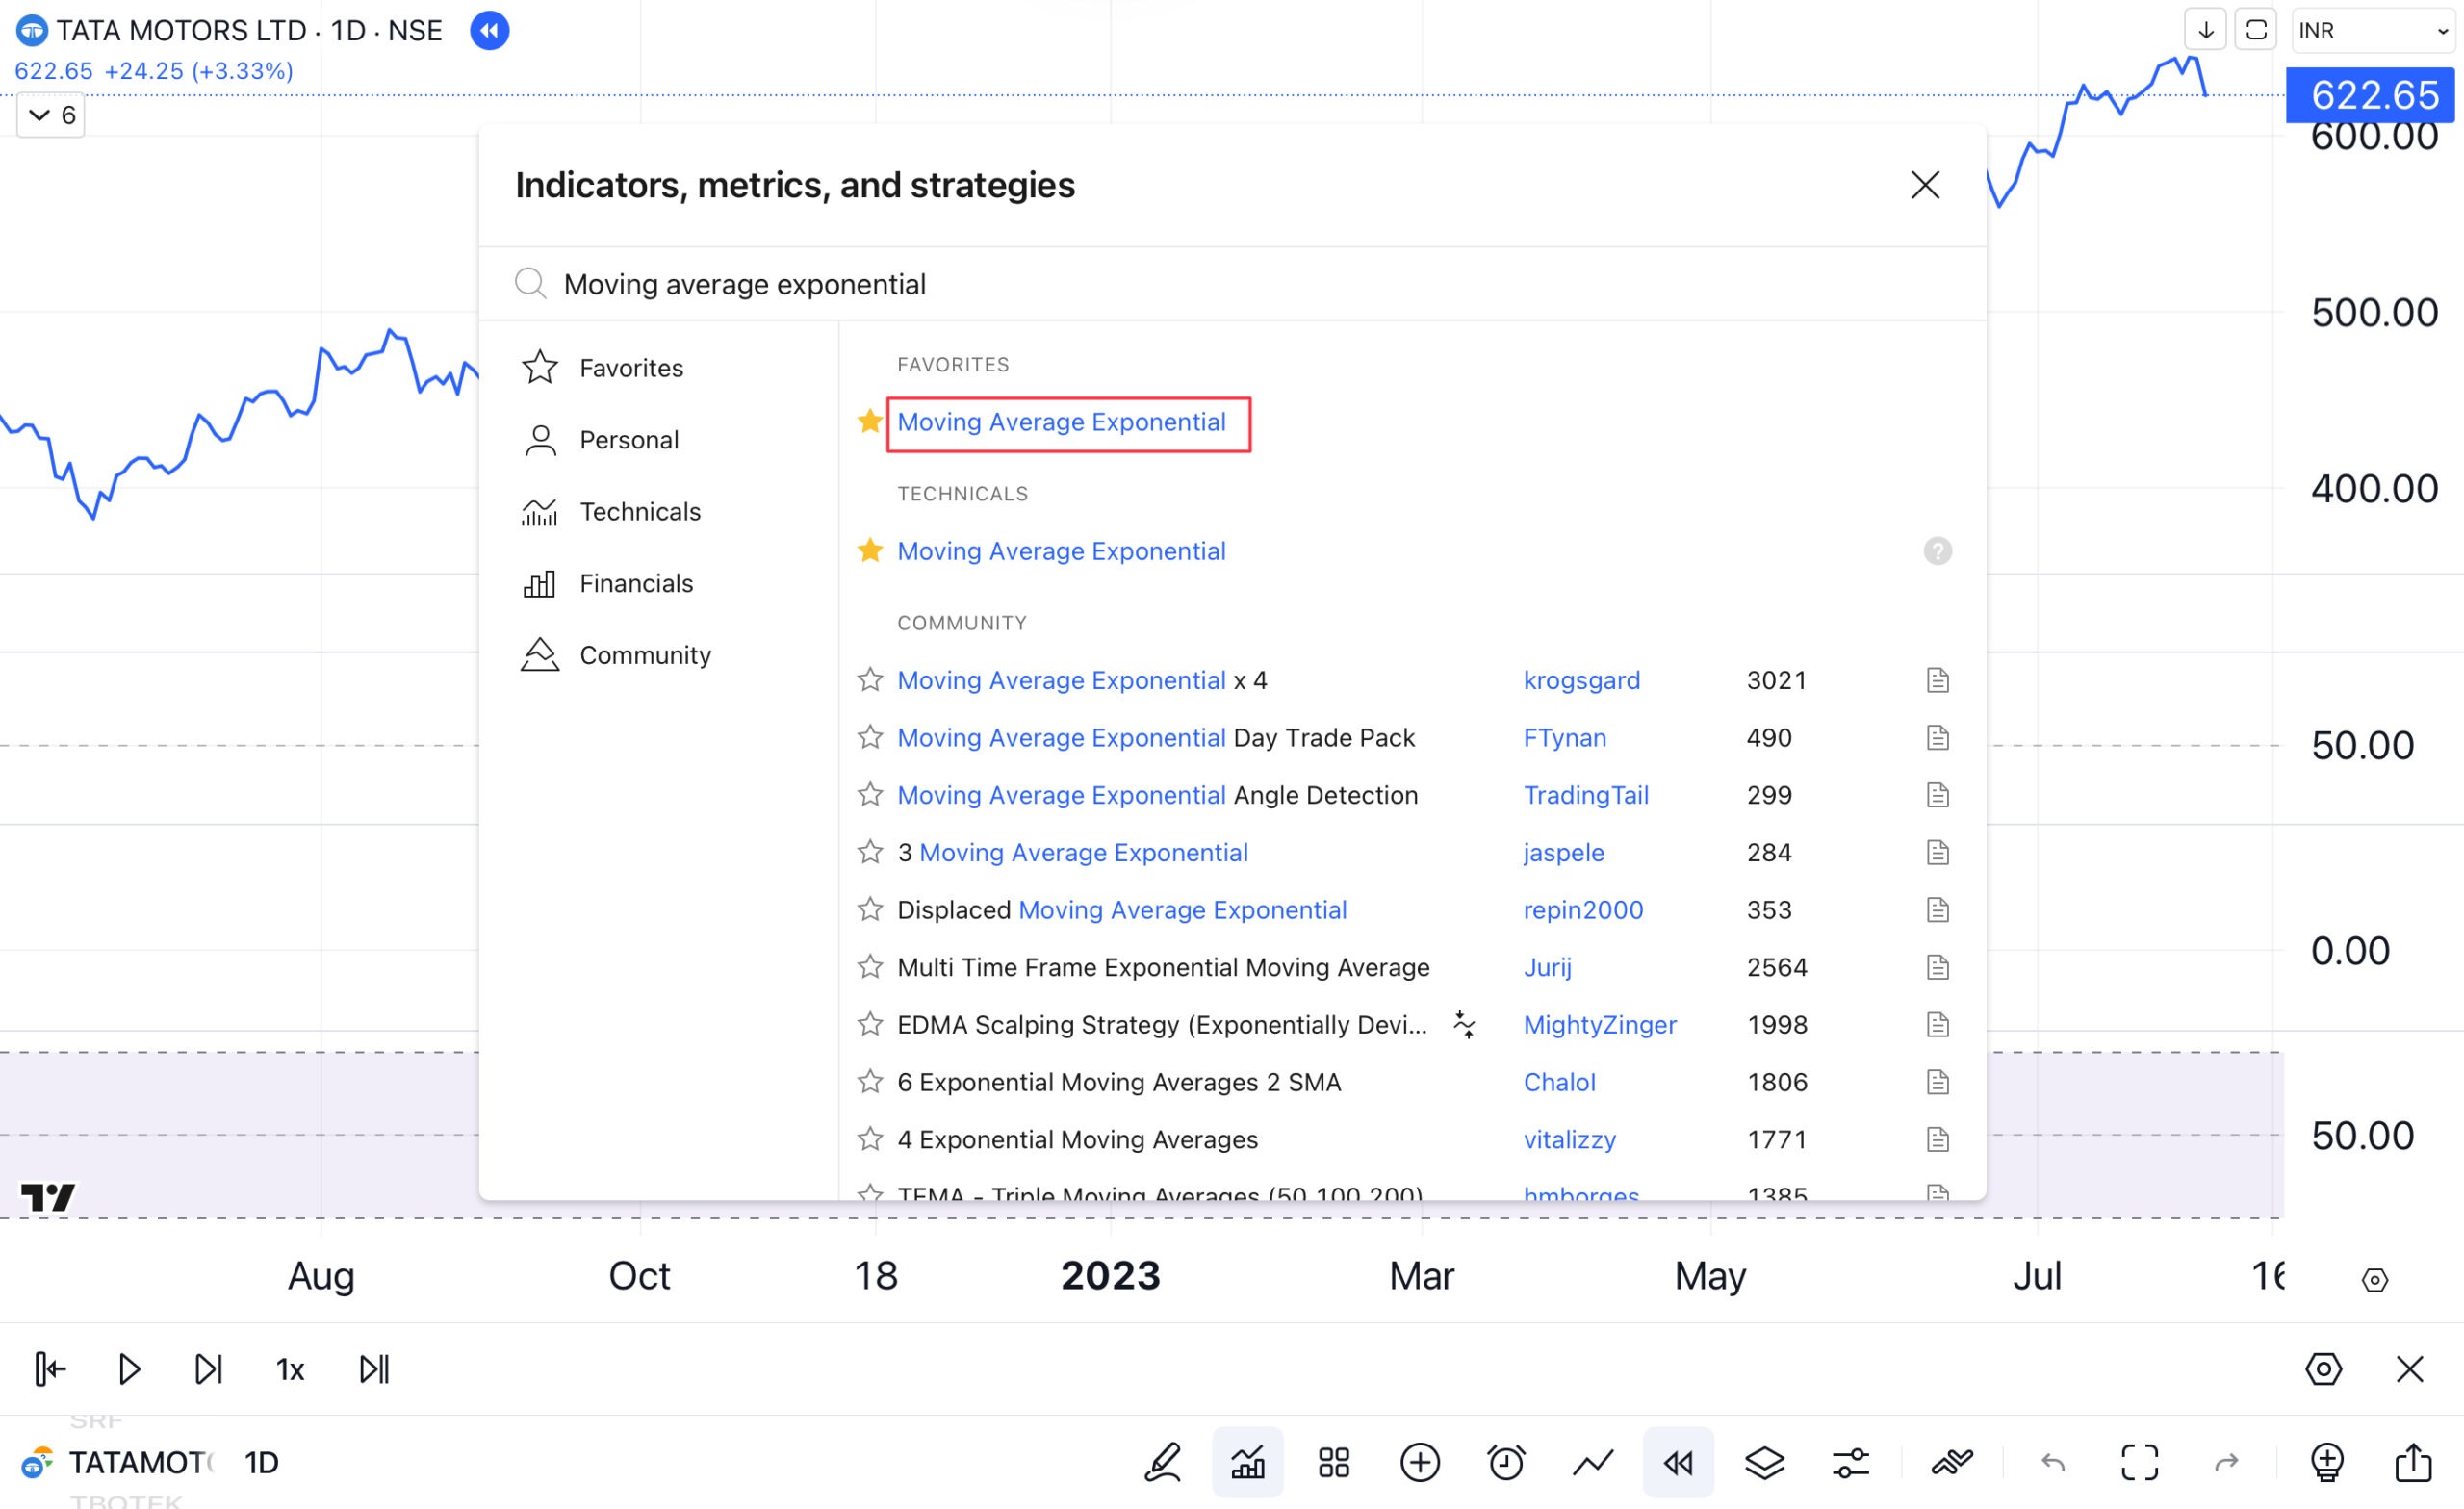
Figure 3.2 EMA 21 added to the daily line chart of Nifty50
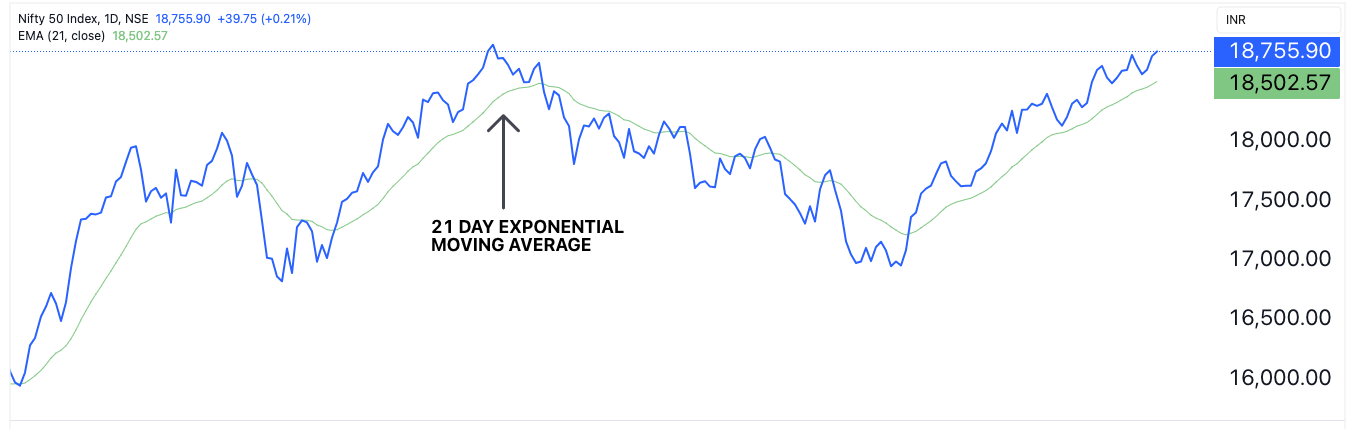
Figure 3.3 21-day EMA and 55-day EMA plotted on the daily line chart of Nifty50
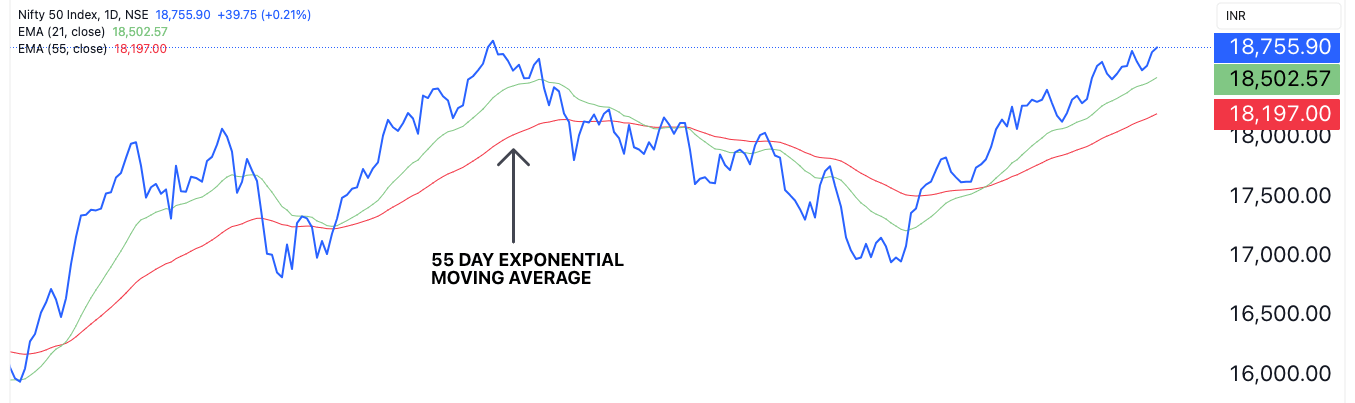
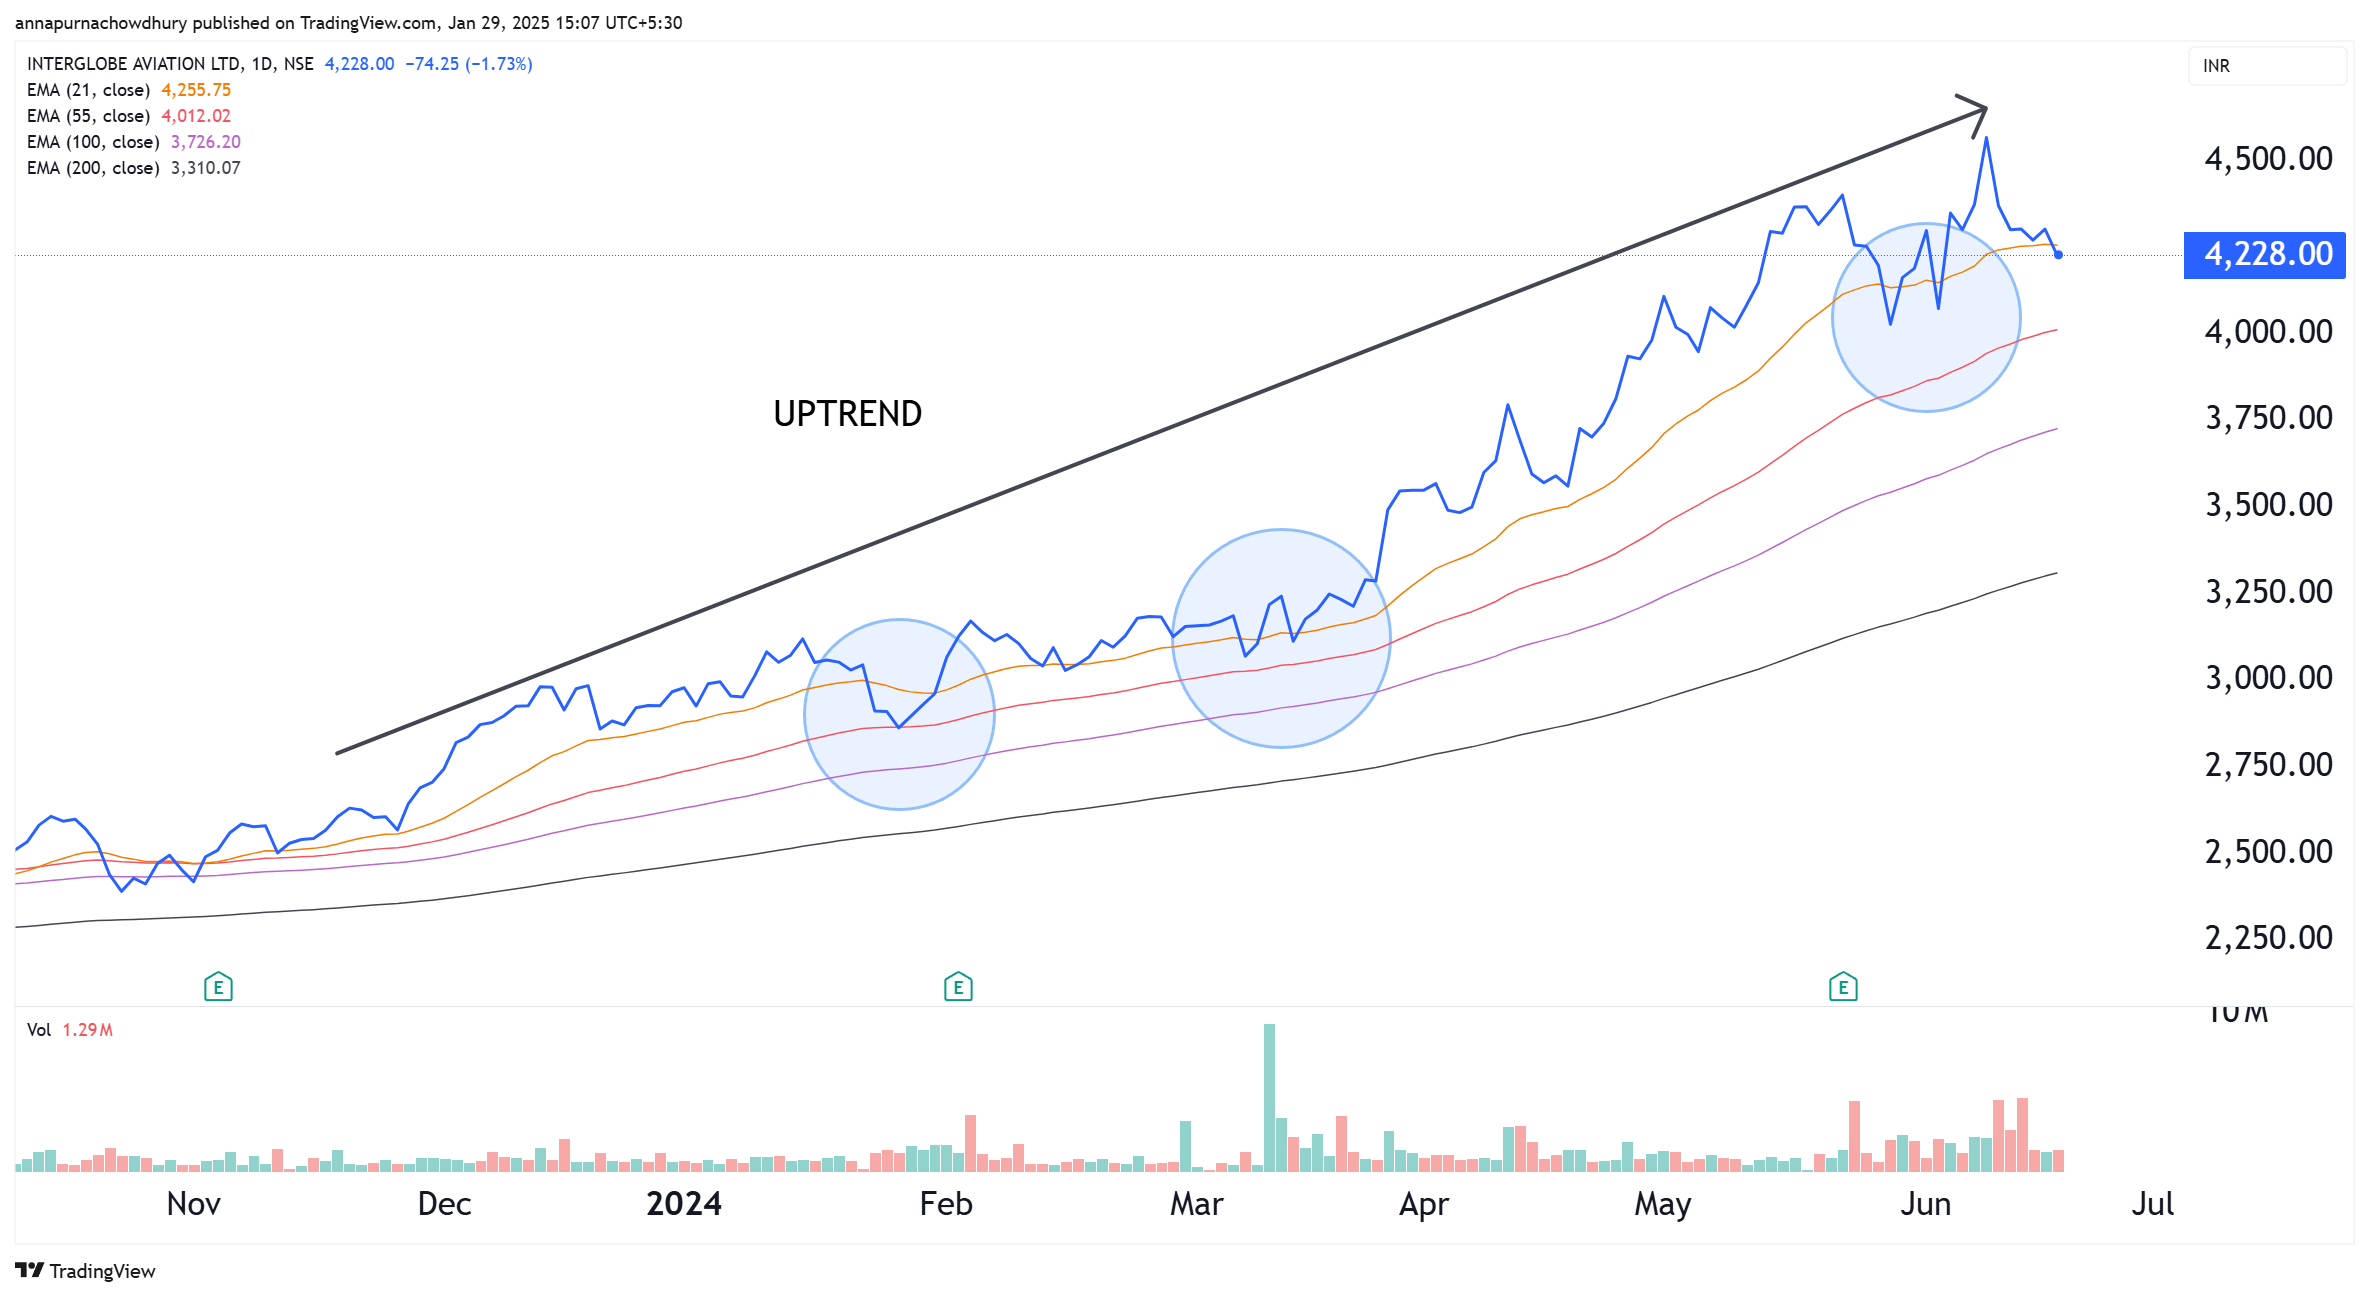
Figure 3.4 21-day EMA, 55-day EMA, 100-day EMA and 200-day EMA plotted on the daily line chart of Nifty50
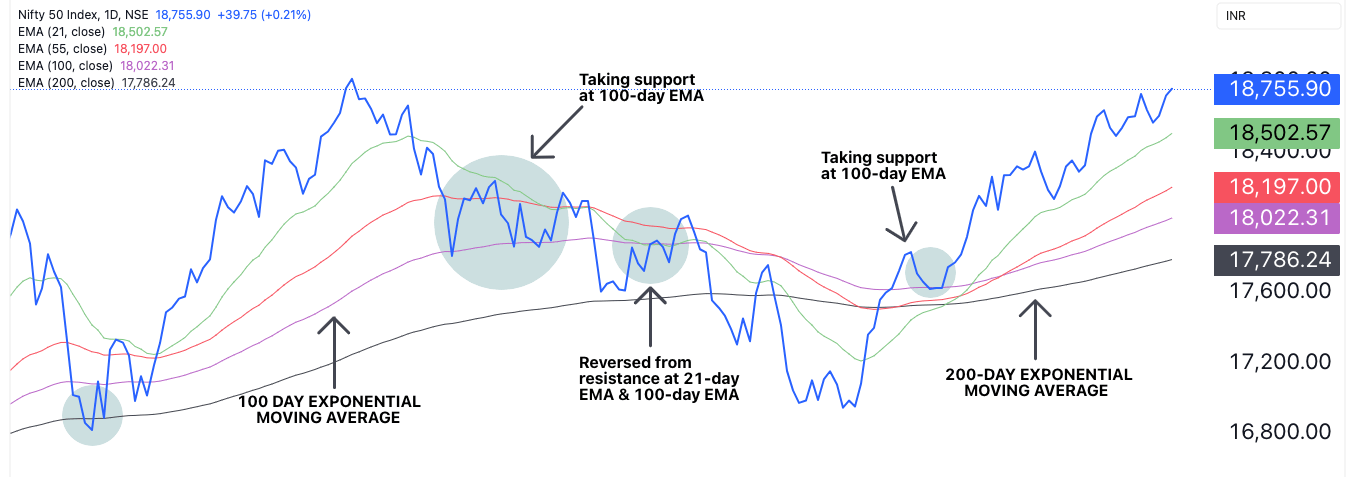
Figure 3.5 21-day EMA, 55-day EMA,100-day EMA and 200-day EMA plotted on the daily line chart of ITC Ltd
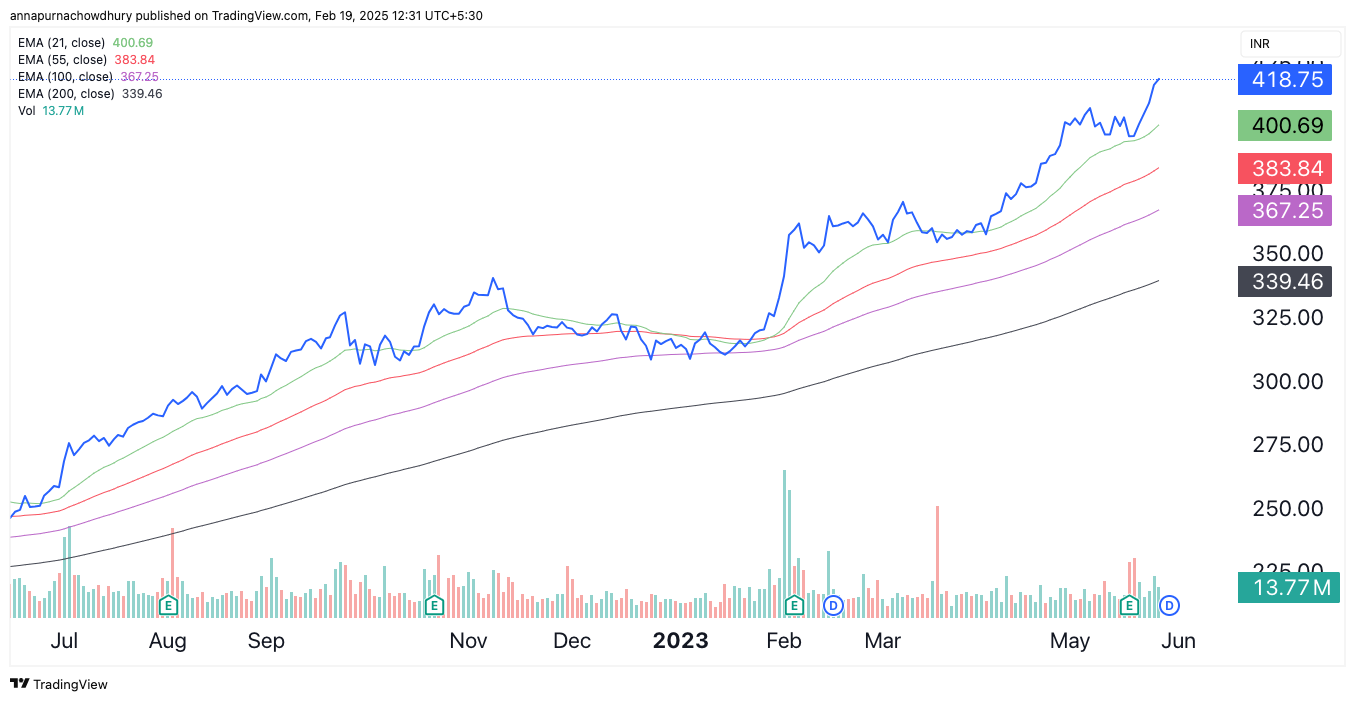
Figure 3.6 Standard EMA durations
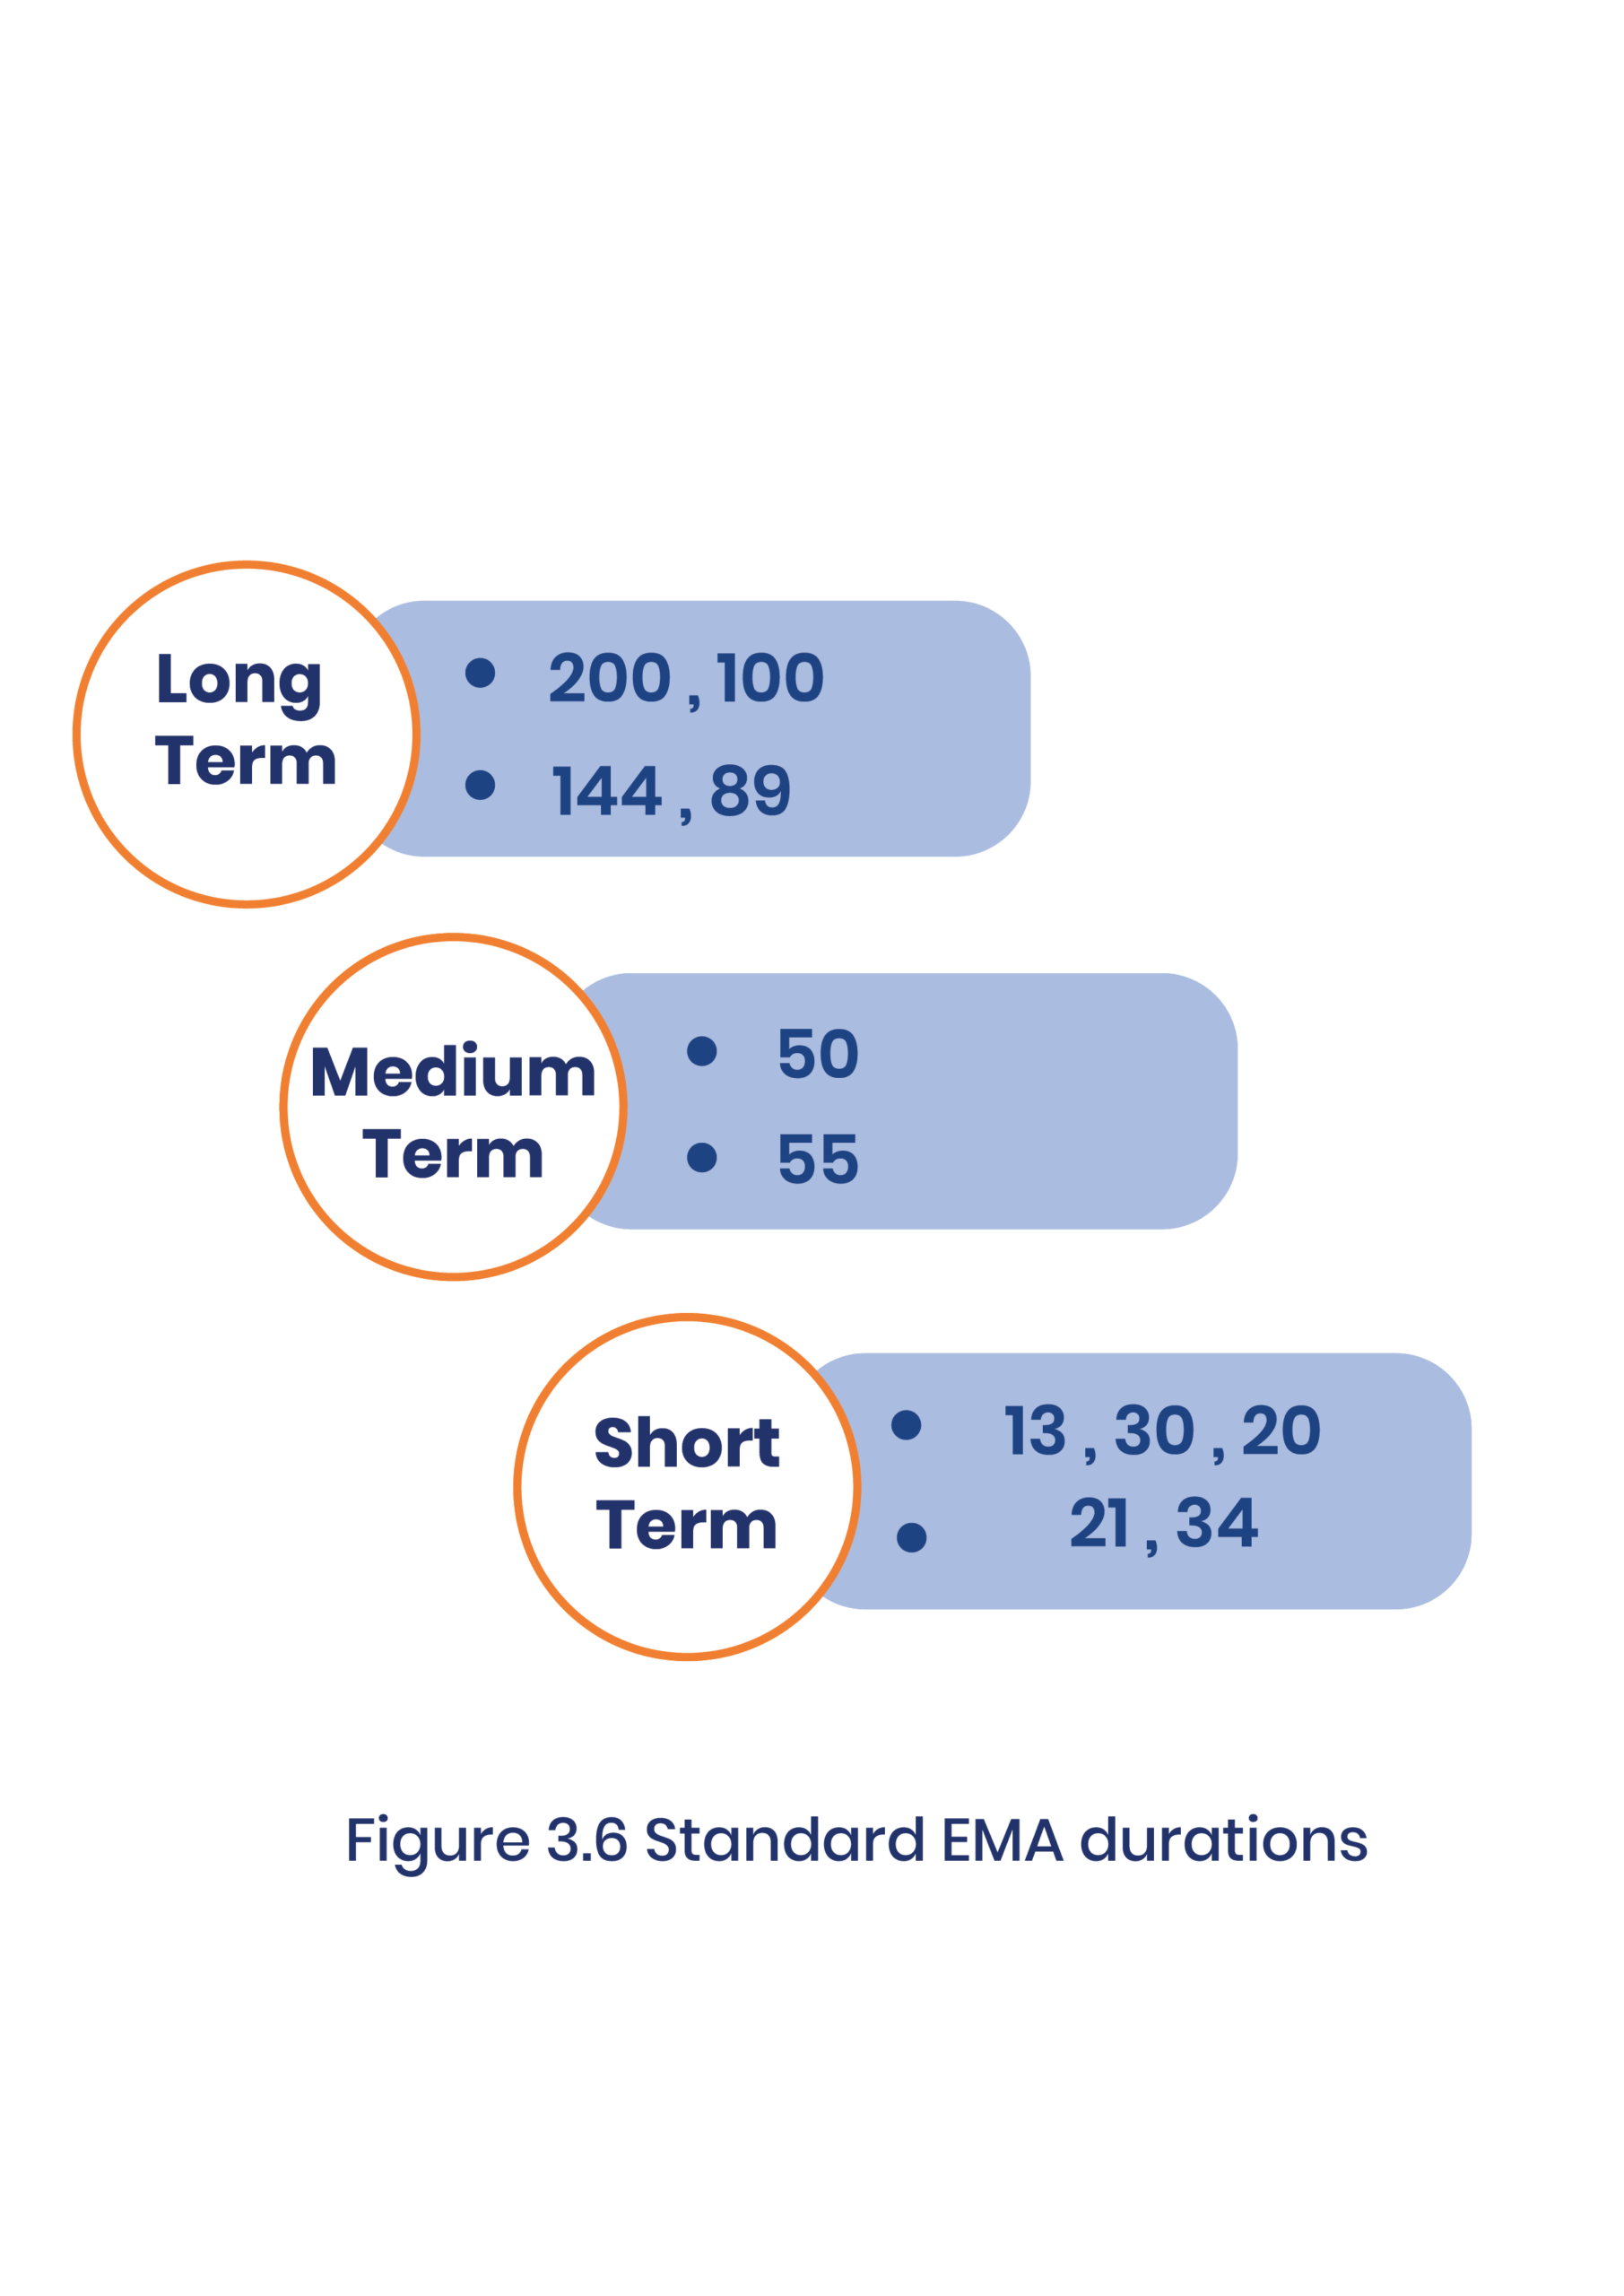
Figure 3.7 21-day EMA, 55-day EMA, 100-day EMA and 200-day EMA plotted on the daily line chart of Nifty50
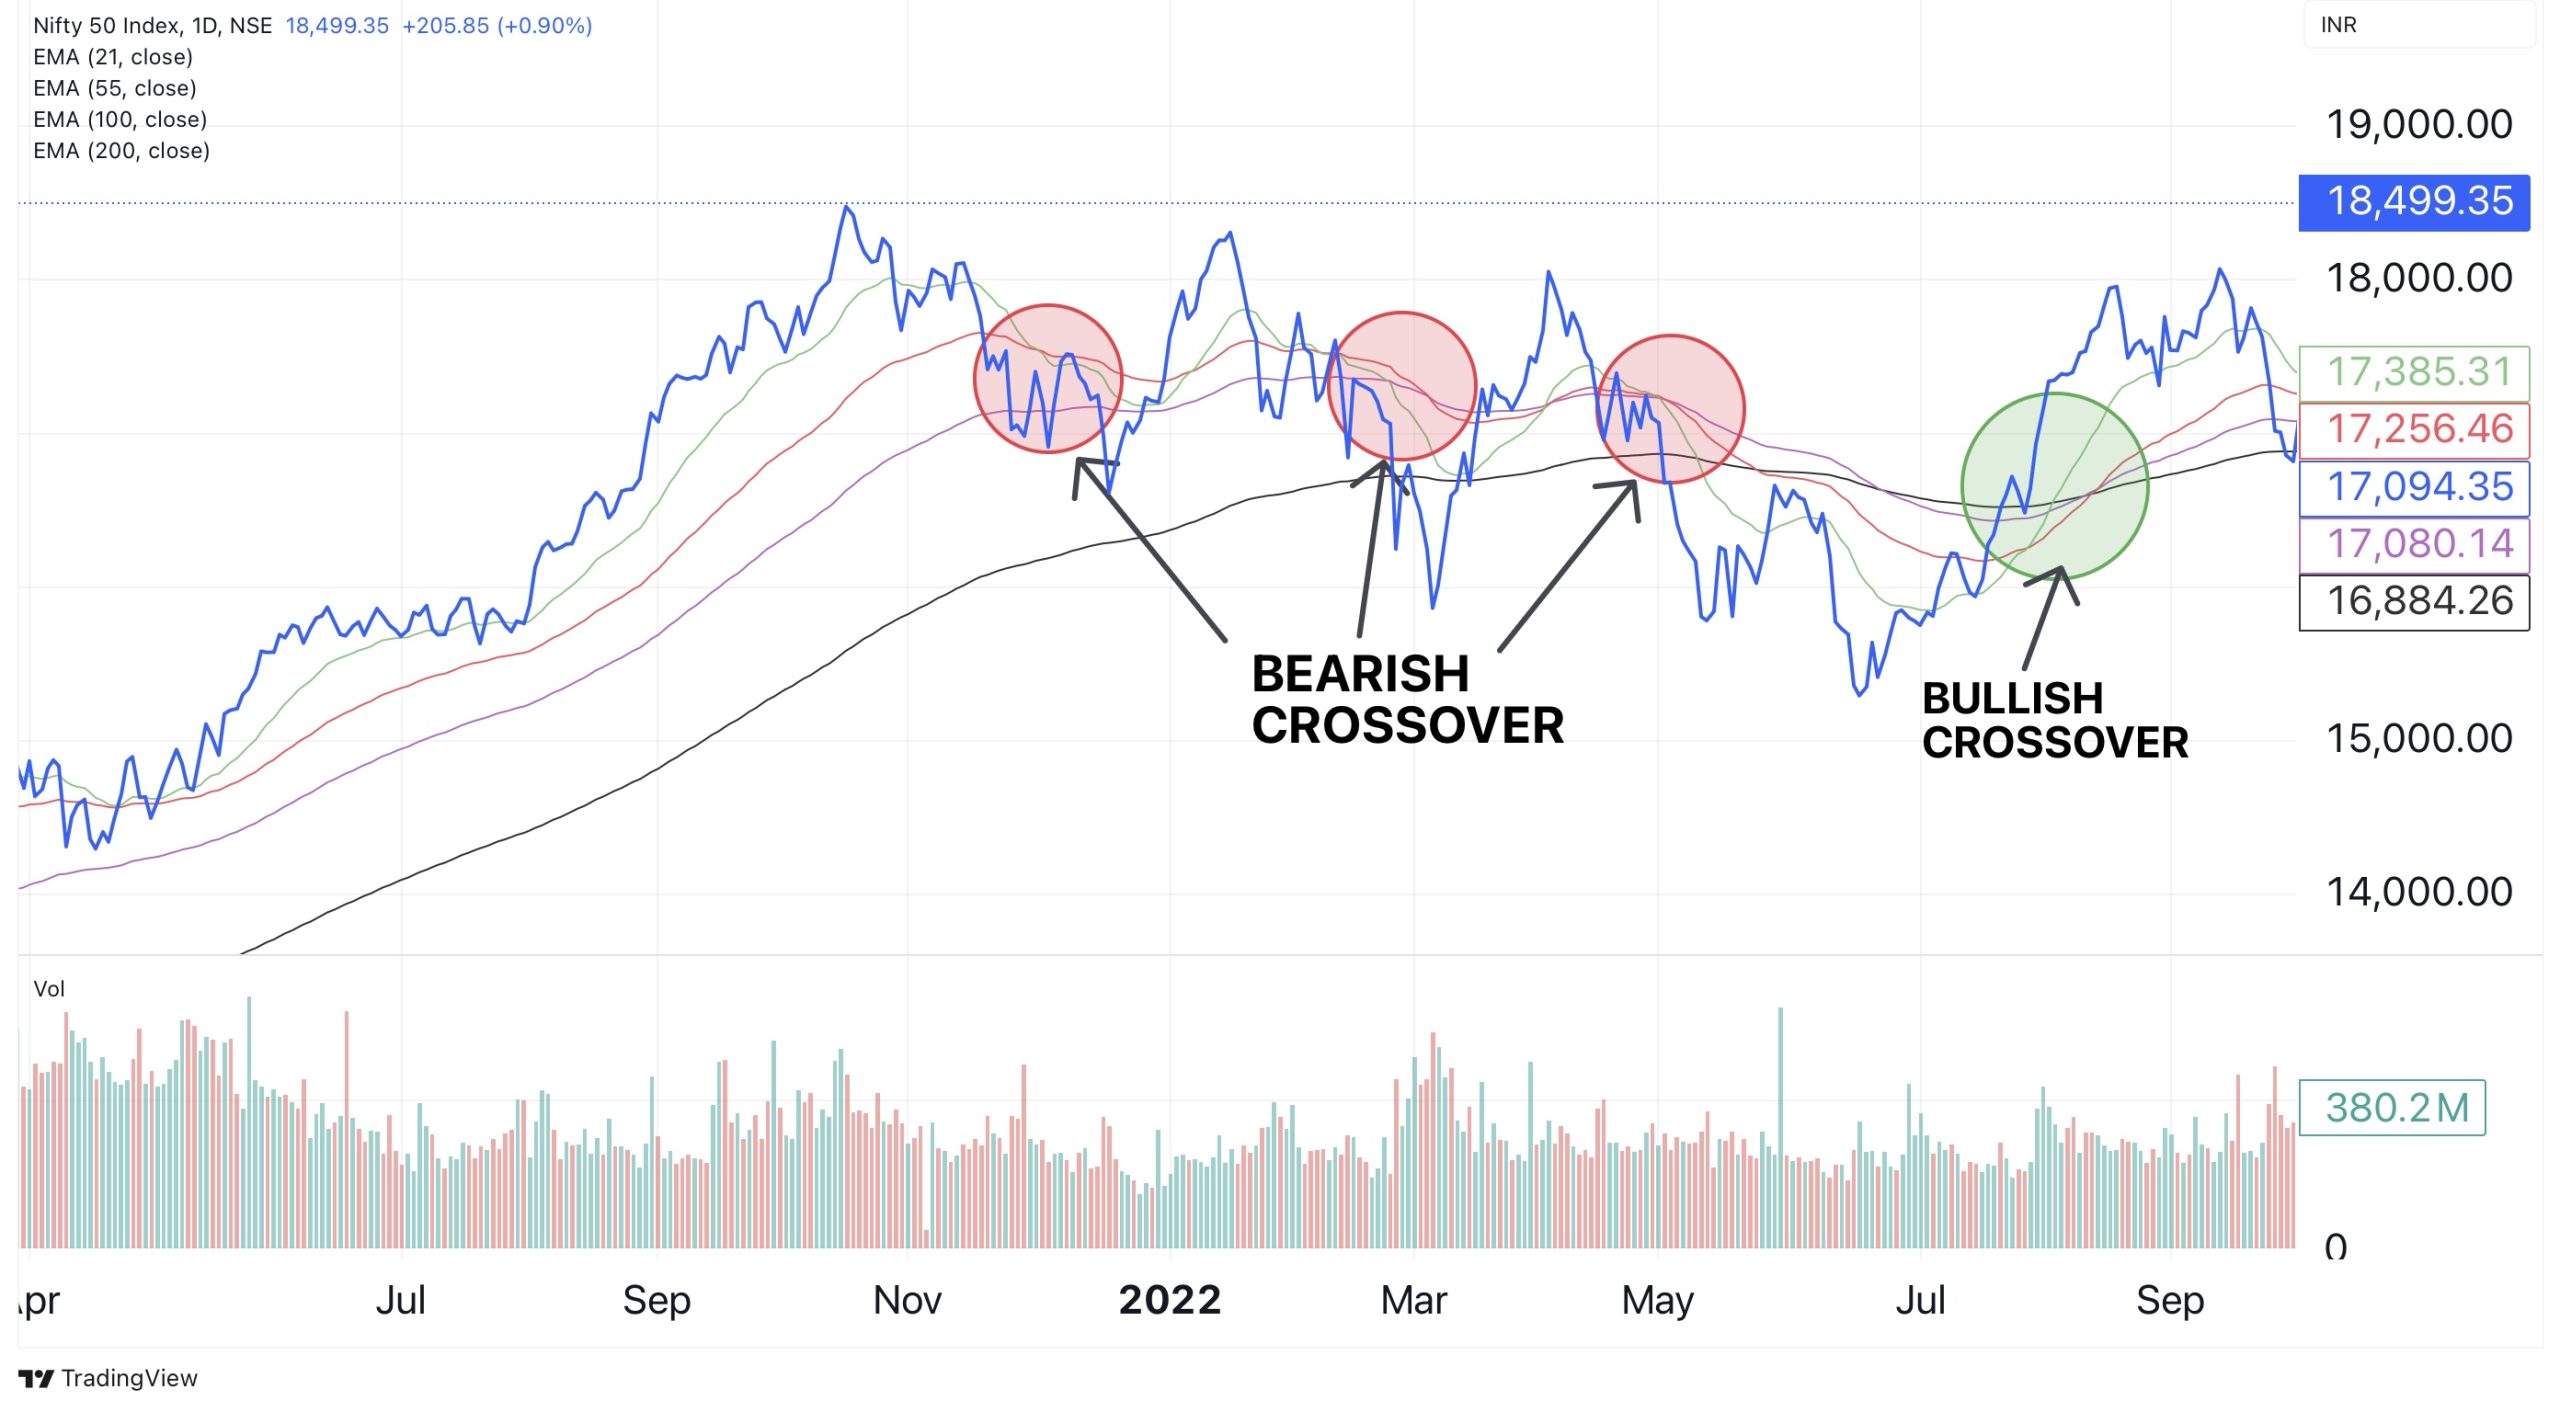
Figure 3.8
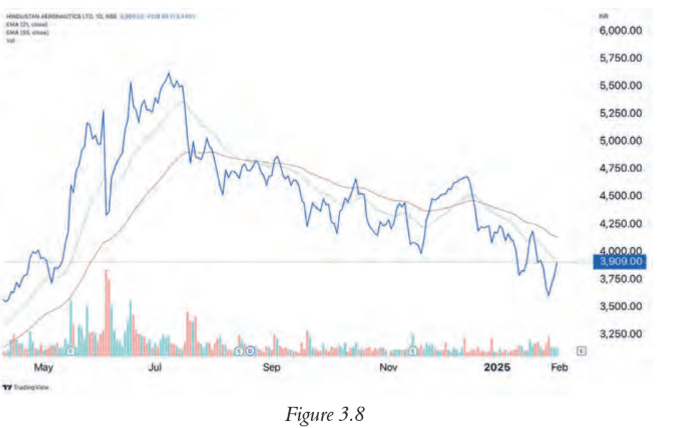
Figure 3.9
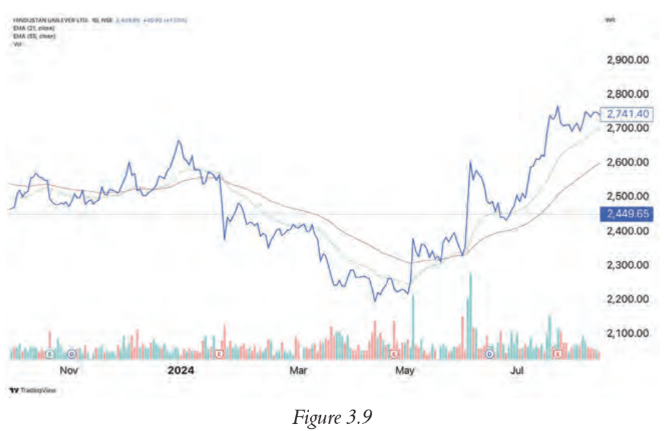
Figure 3.10
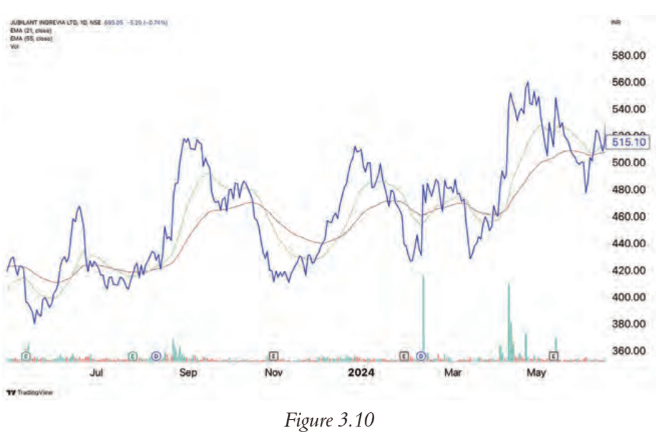
Figure 3.11
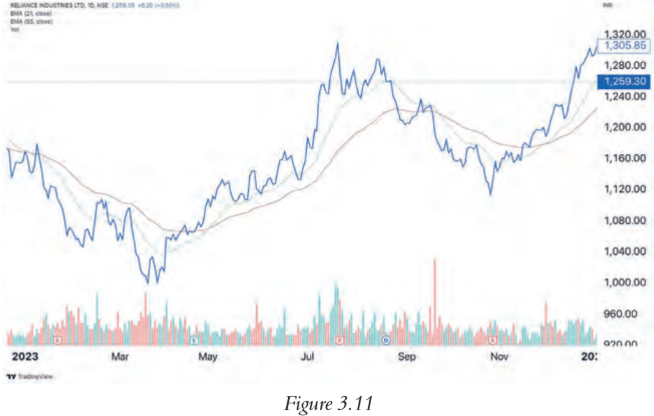
Figure 3.12