Table 4.2 List of indices as per their 1-month performance
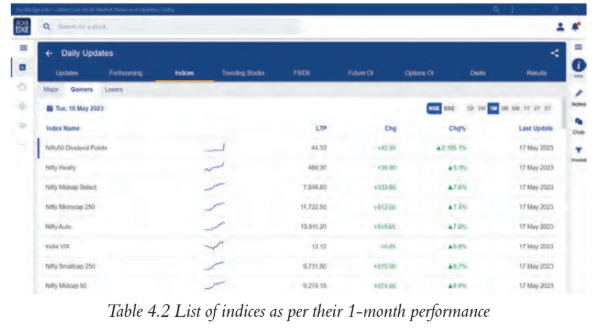
Table 4.3 Stocks that make up the Nifty Realty index
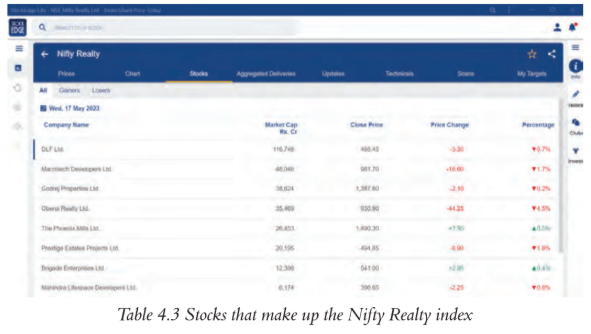
Table 4.4 List of gainers of Nifty Realty
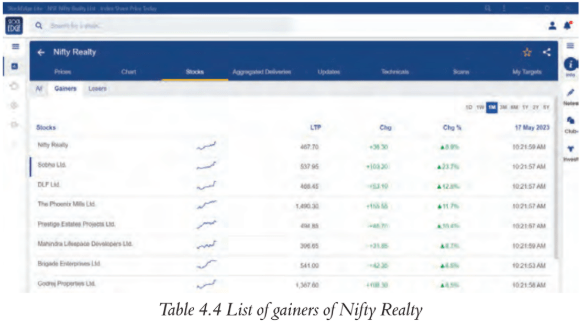
Figure 4.4 Daily line chart of Nifty Realty index
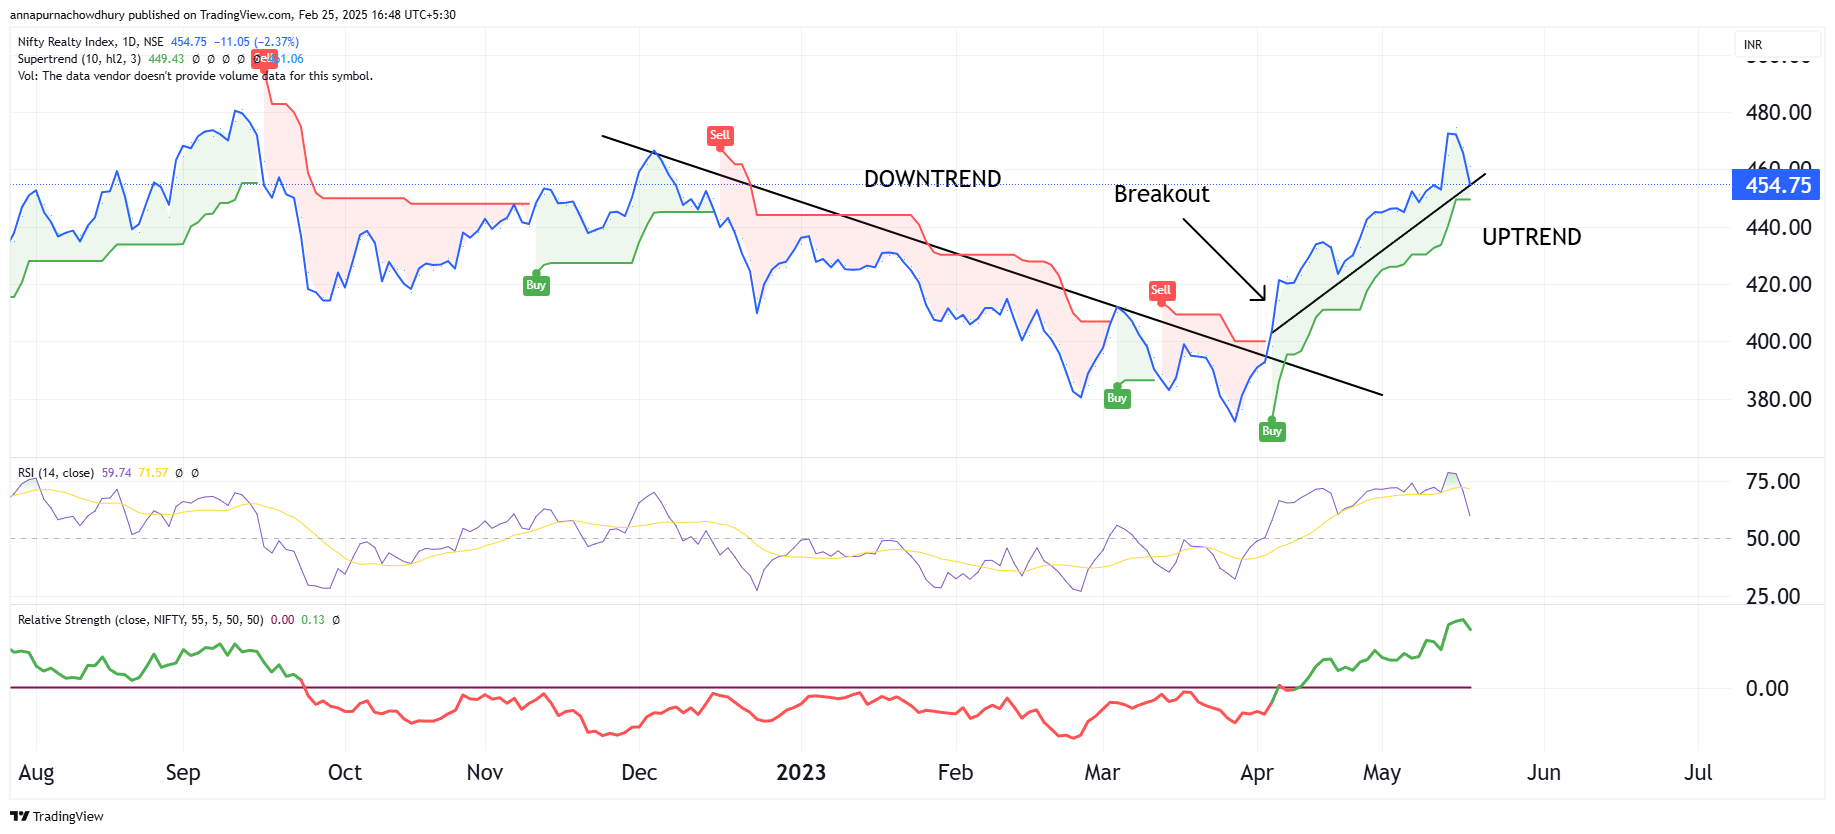
Figure 4.5 Daily line chart of Sobha Ltd
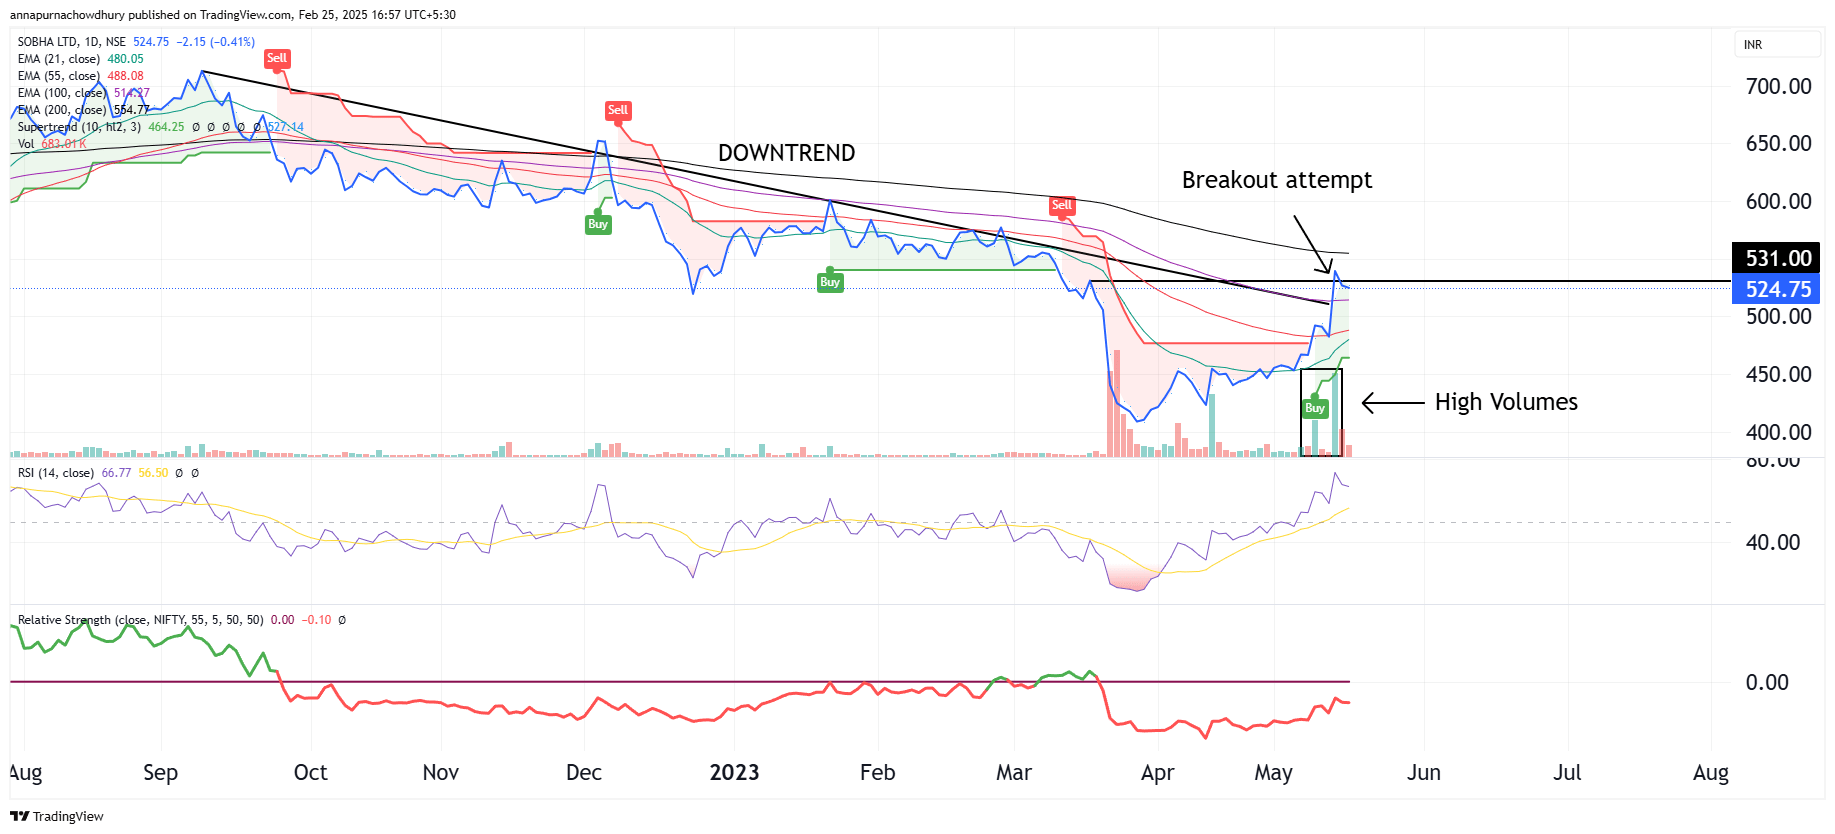
Figure 4.6 Daily line chart of DLF Ltd
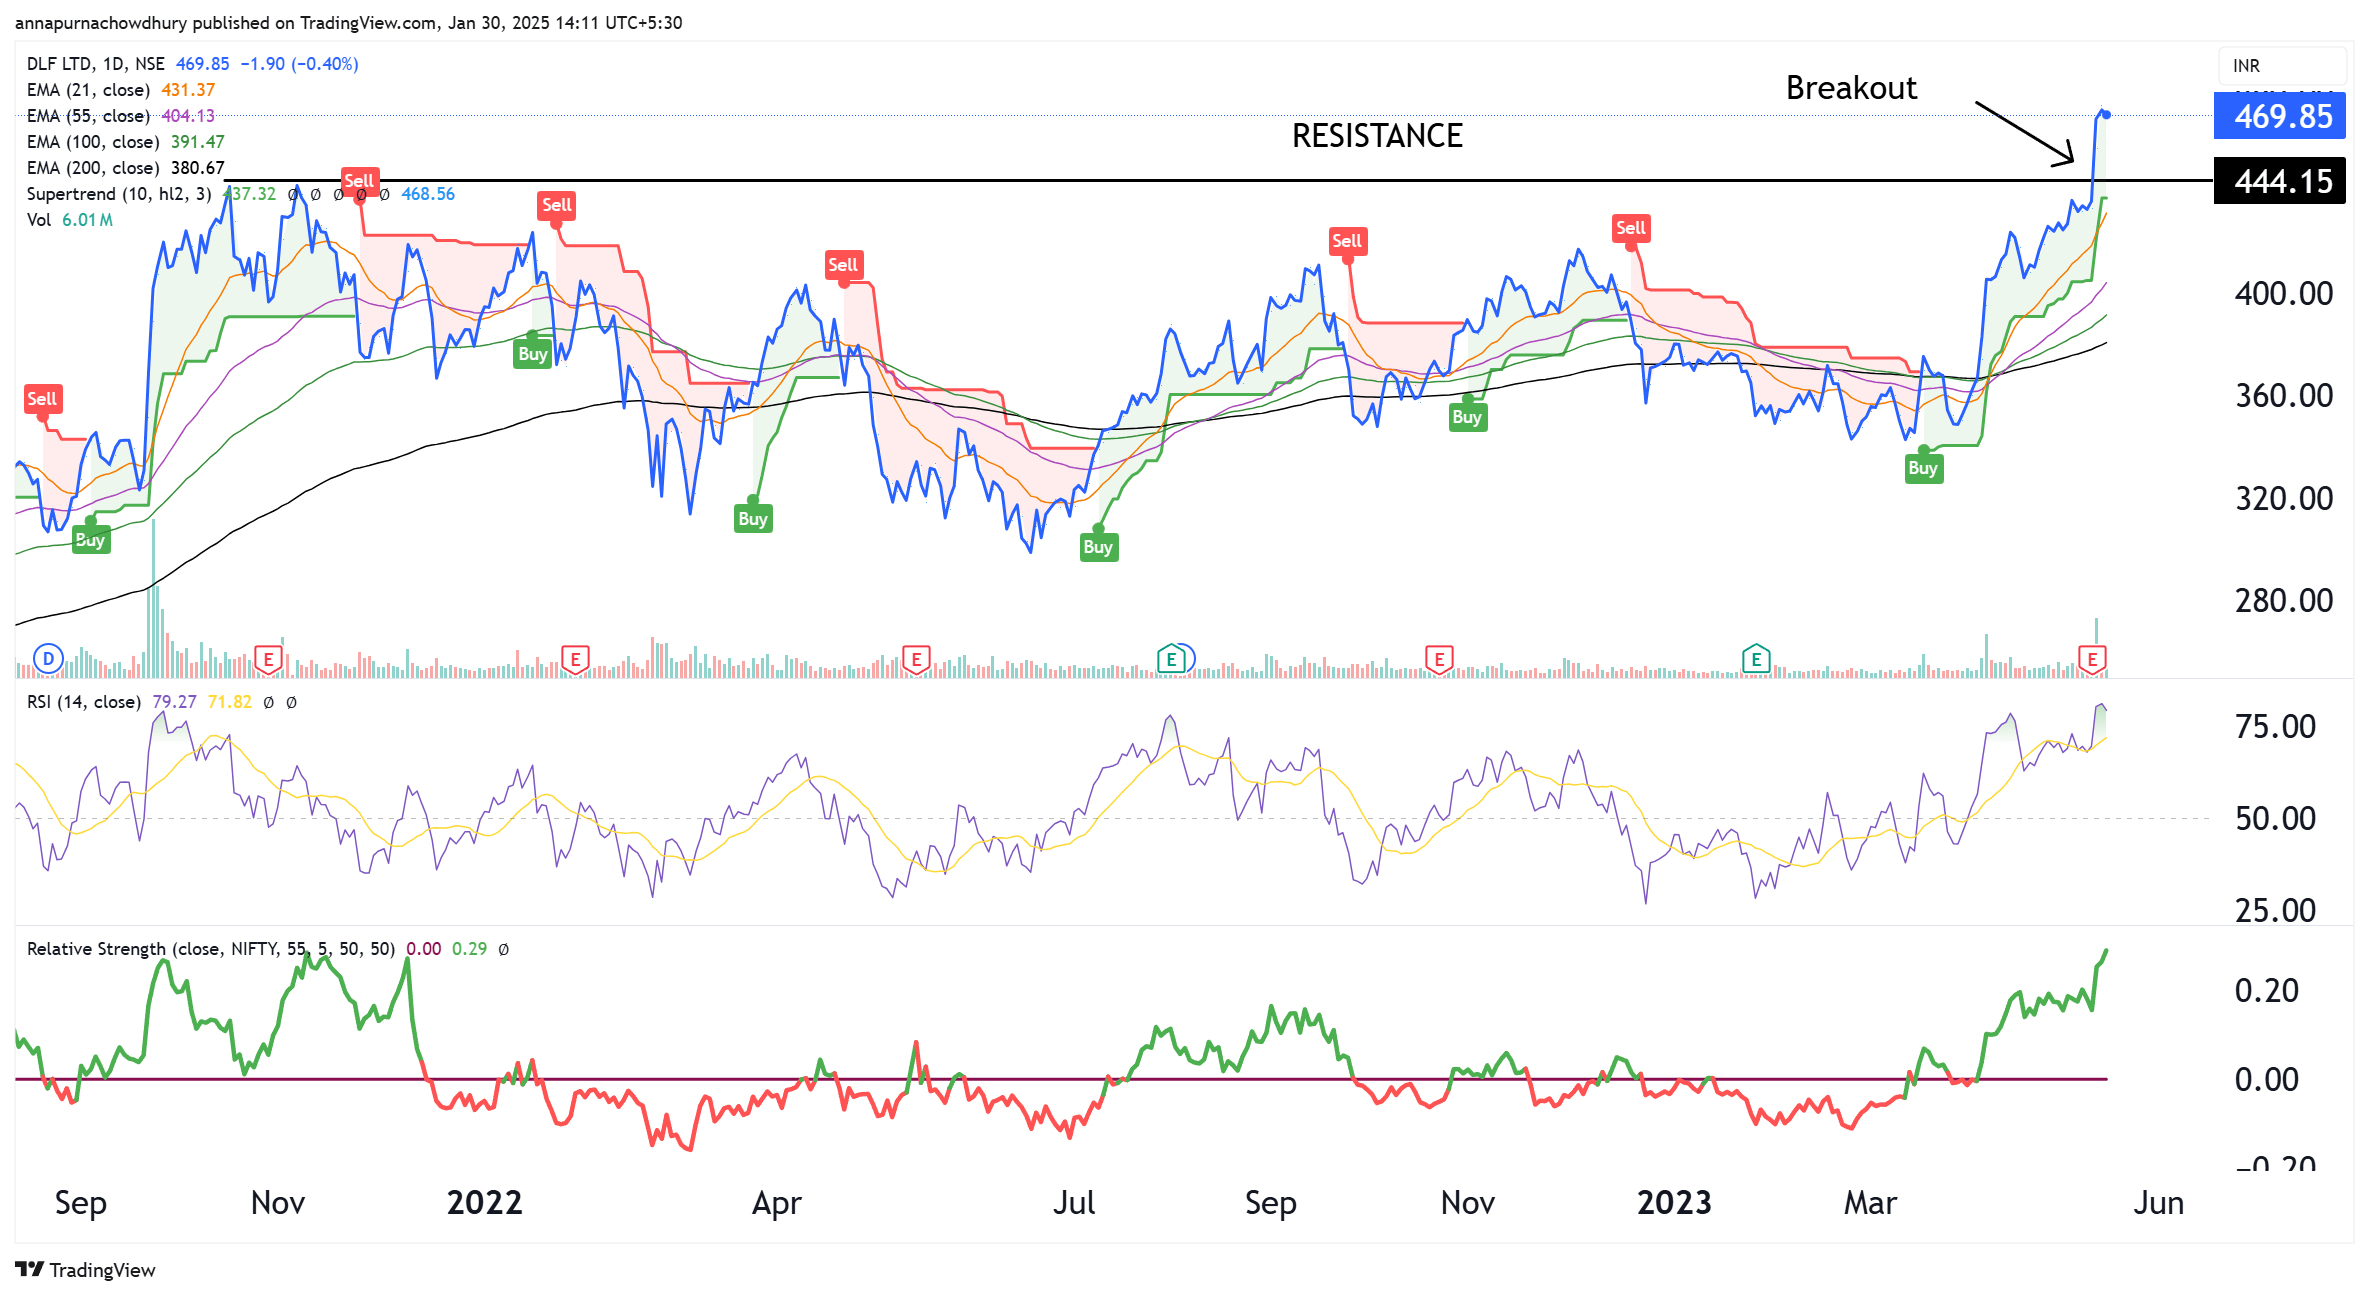
Figure 4.6 Daily line chart of DLF Ltd
Table 4.5 Sectoral breadth analysis in StockEdge
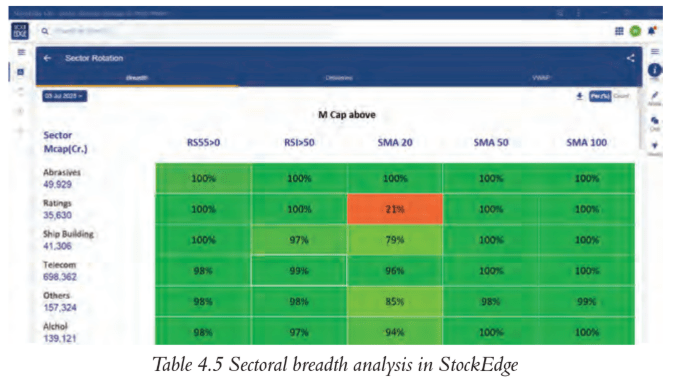
Figure 4.7 The color scale of sector rotation

Table 4.6 Count of stocks in sectoral breadth analysis in StockEdge
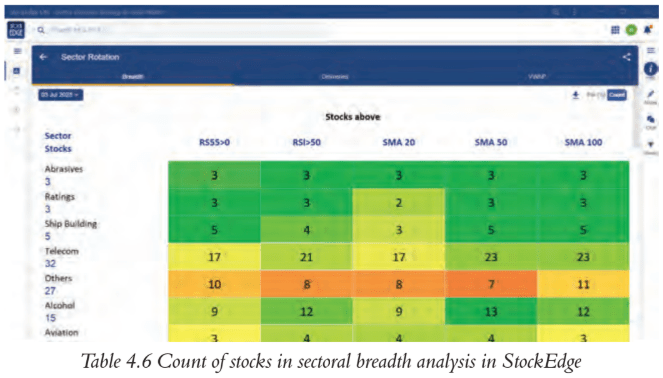
Table 4.7 Stocks in the telecom sector sorted as per the highest gainer in a week
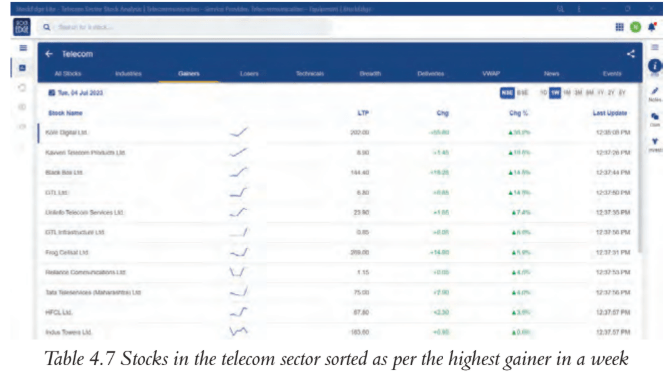
Figure 4.8 Daily chart of Black Box Ltd
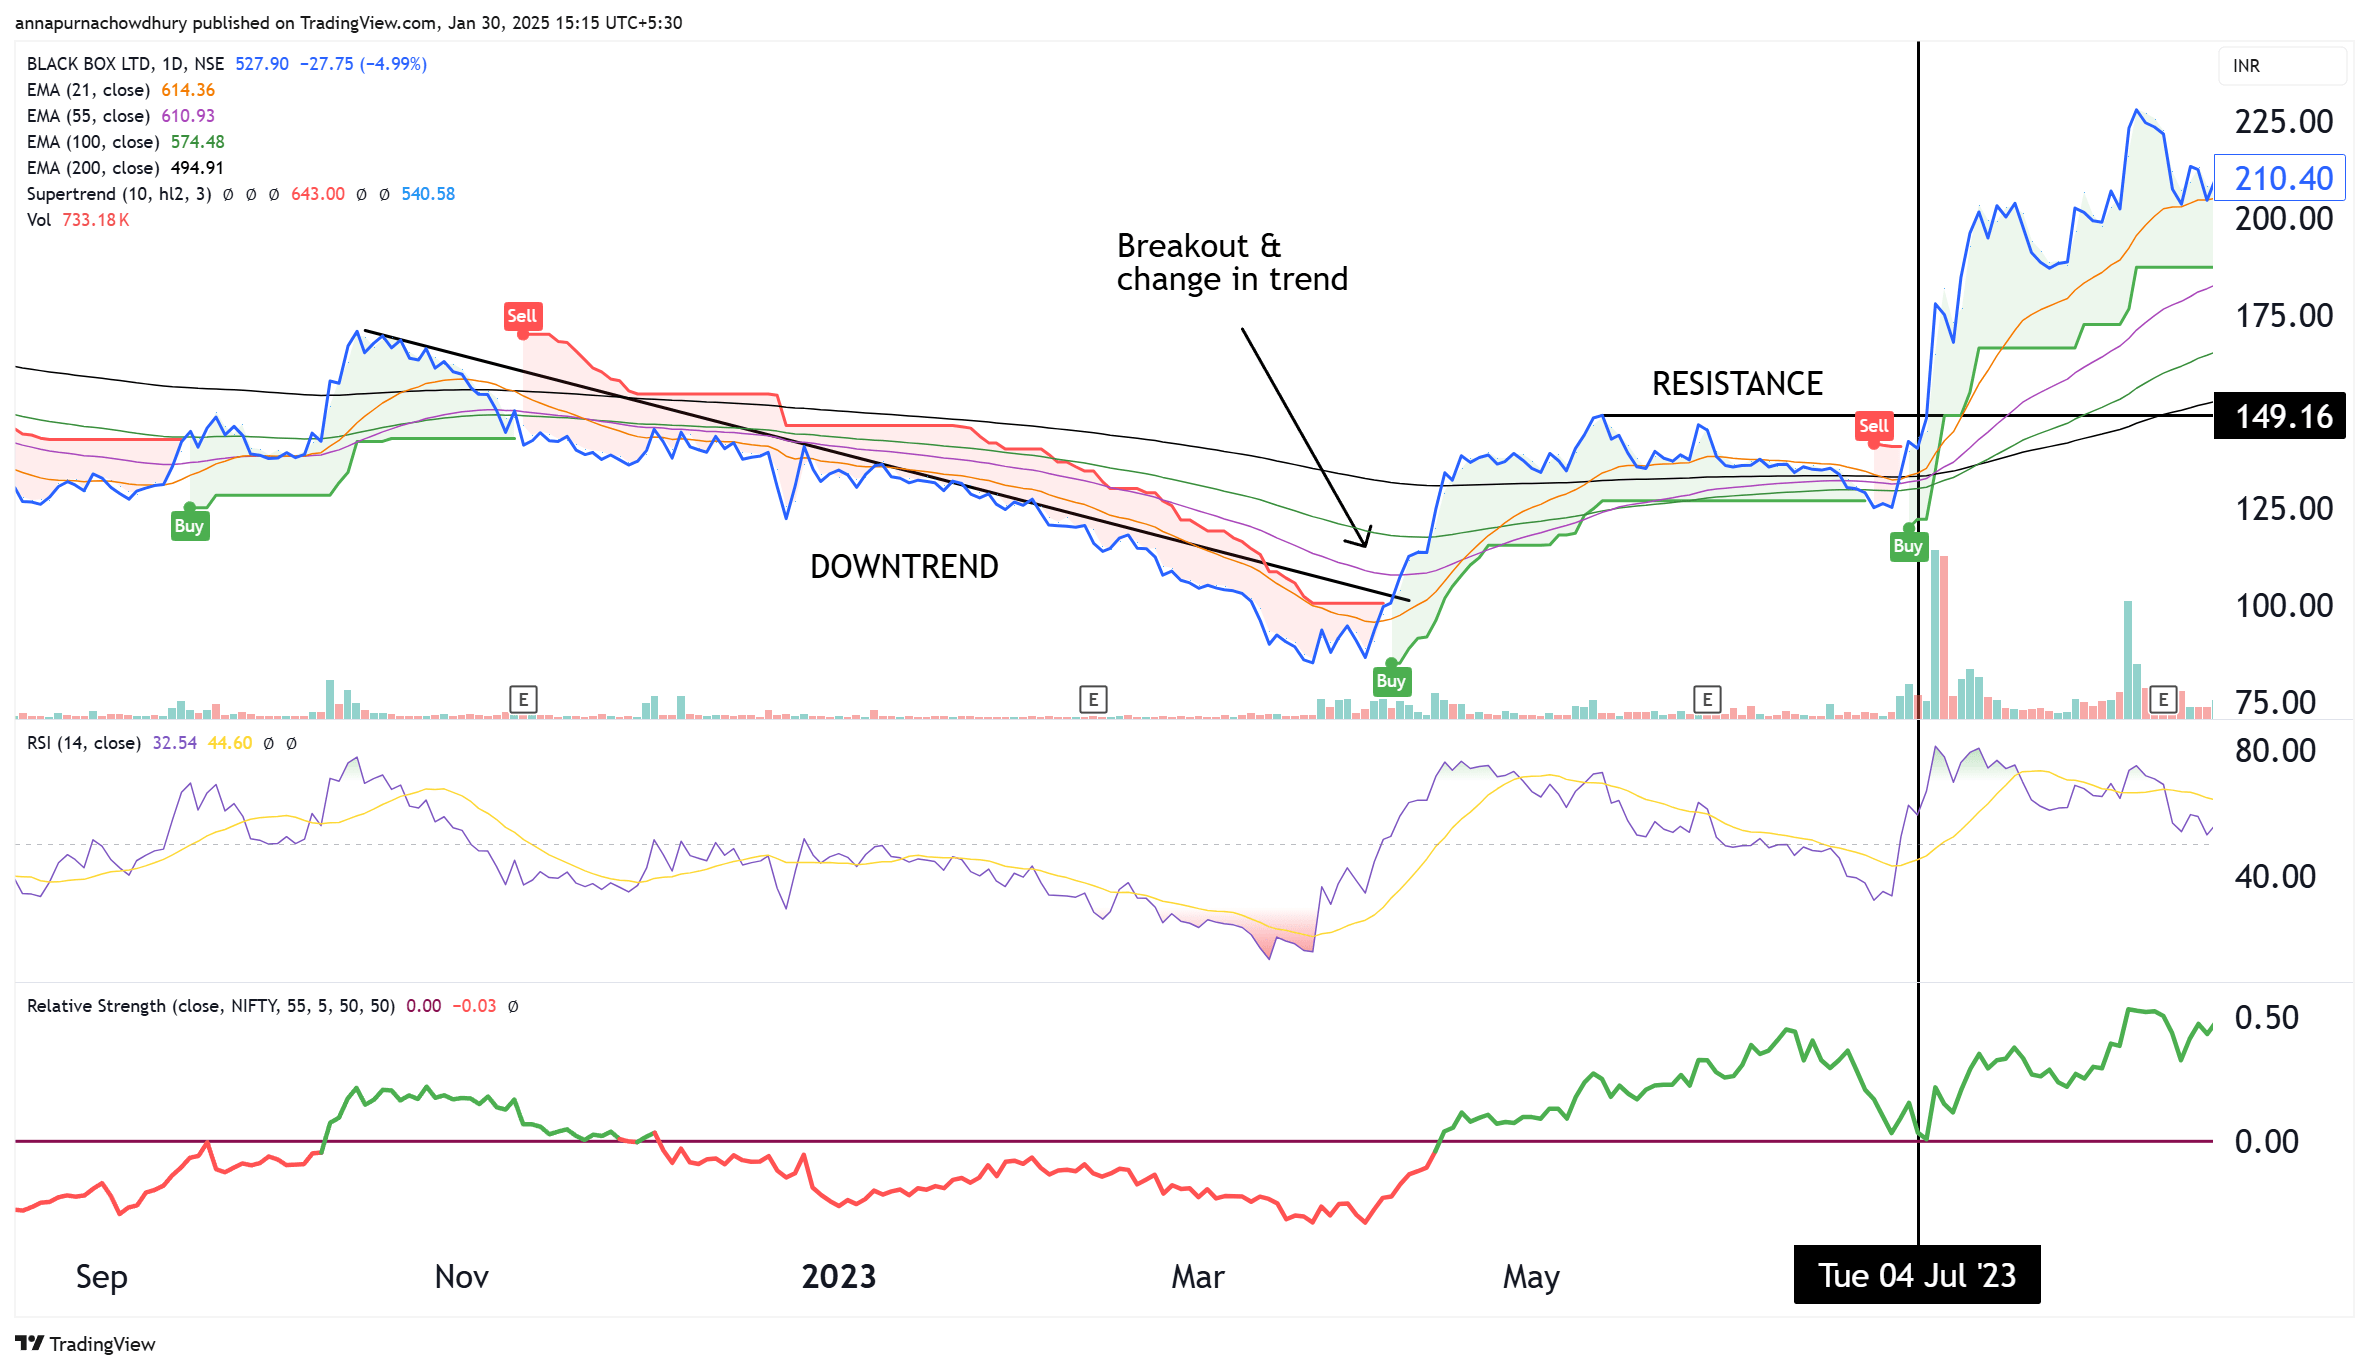
Table 4.8 Sectoral breadth analysis in StockEdge
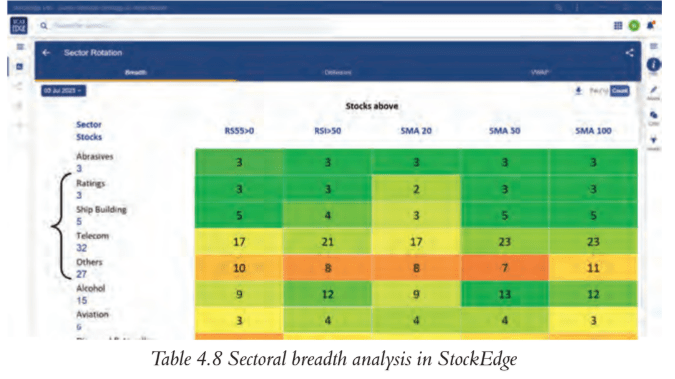
Table 4.9 Delivery analysis of sectors in StockEdge
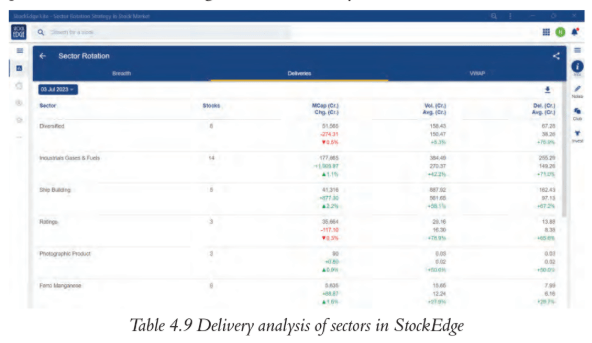
Table 4.10 Delivery analysis of stocks in diversified sector in StockEdge
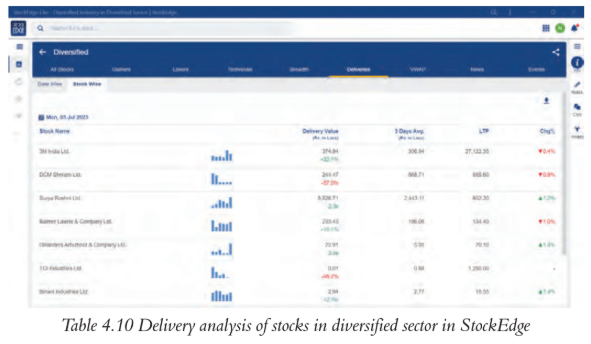
Figure 4.9 Daily chart of 3M India Ltd
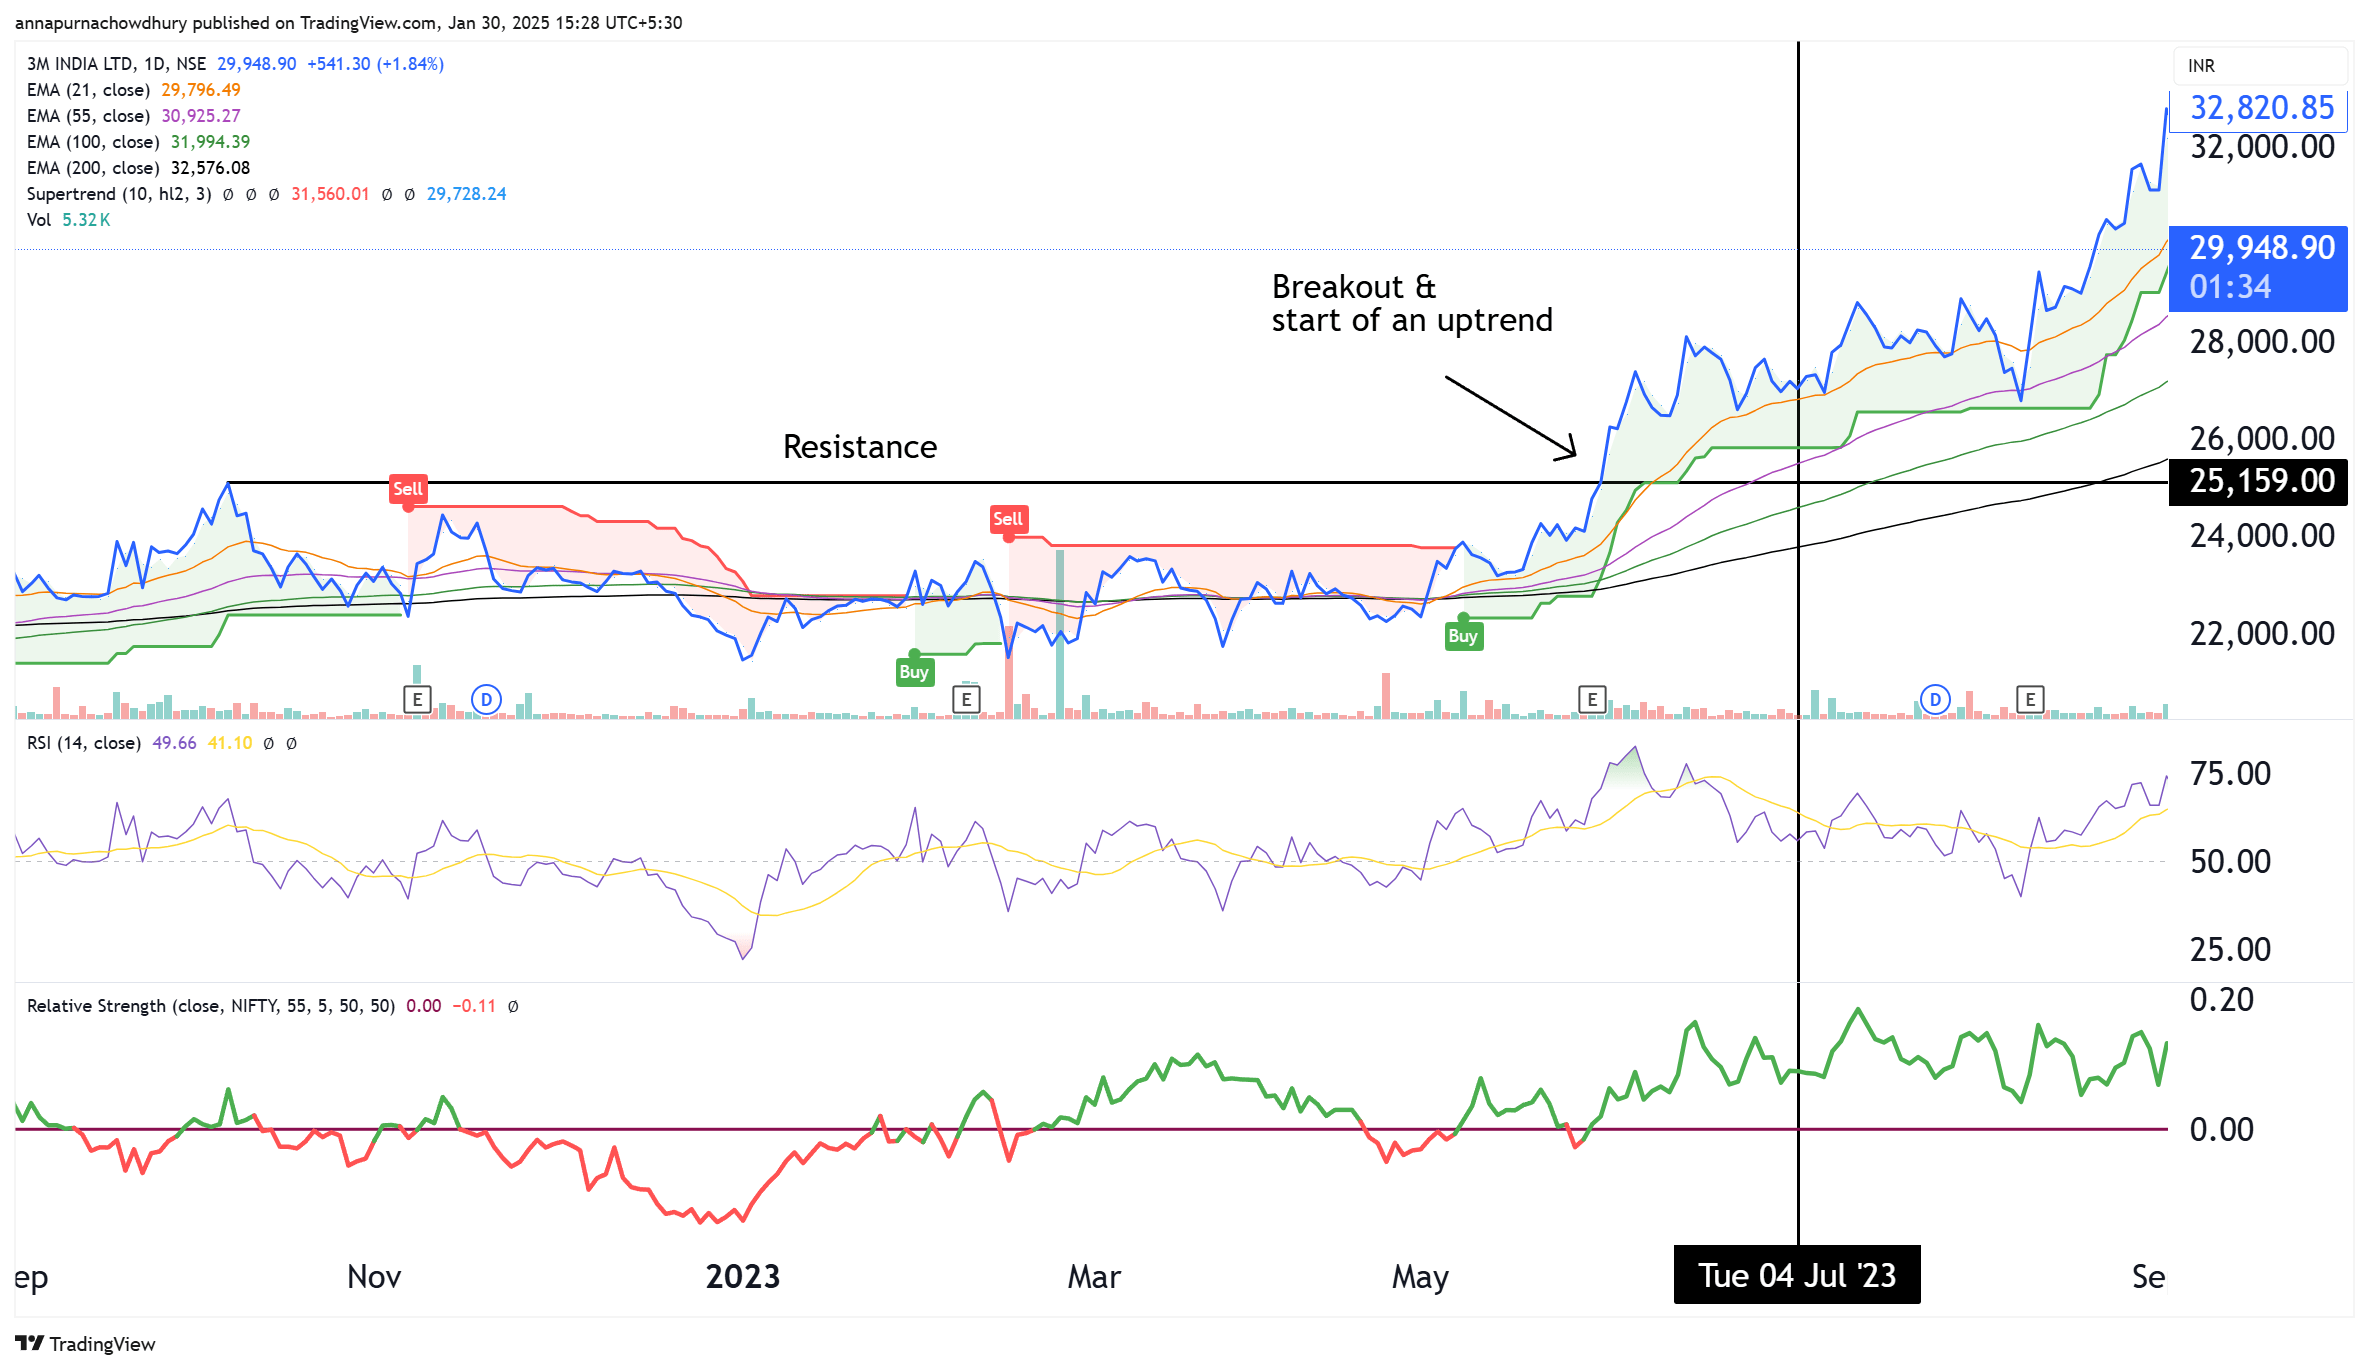
Table 4.11 VWAP analysis of sectors in StockEdge
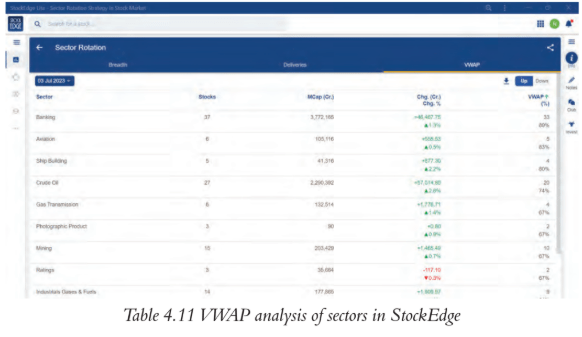
Table 4.12 Technical levels of ship building stocks
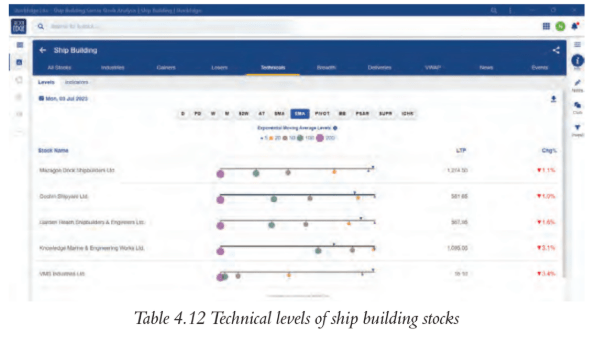
Figure 4.10 Daily chart of Mazagon Dock
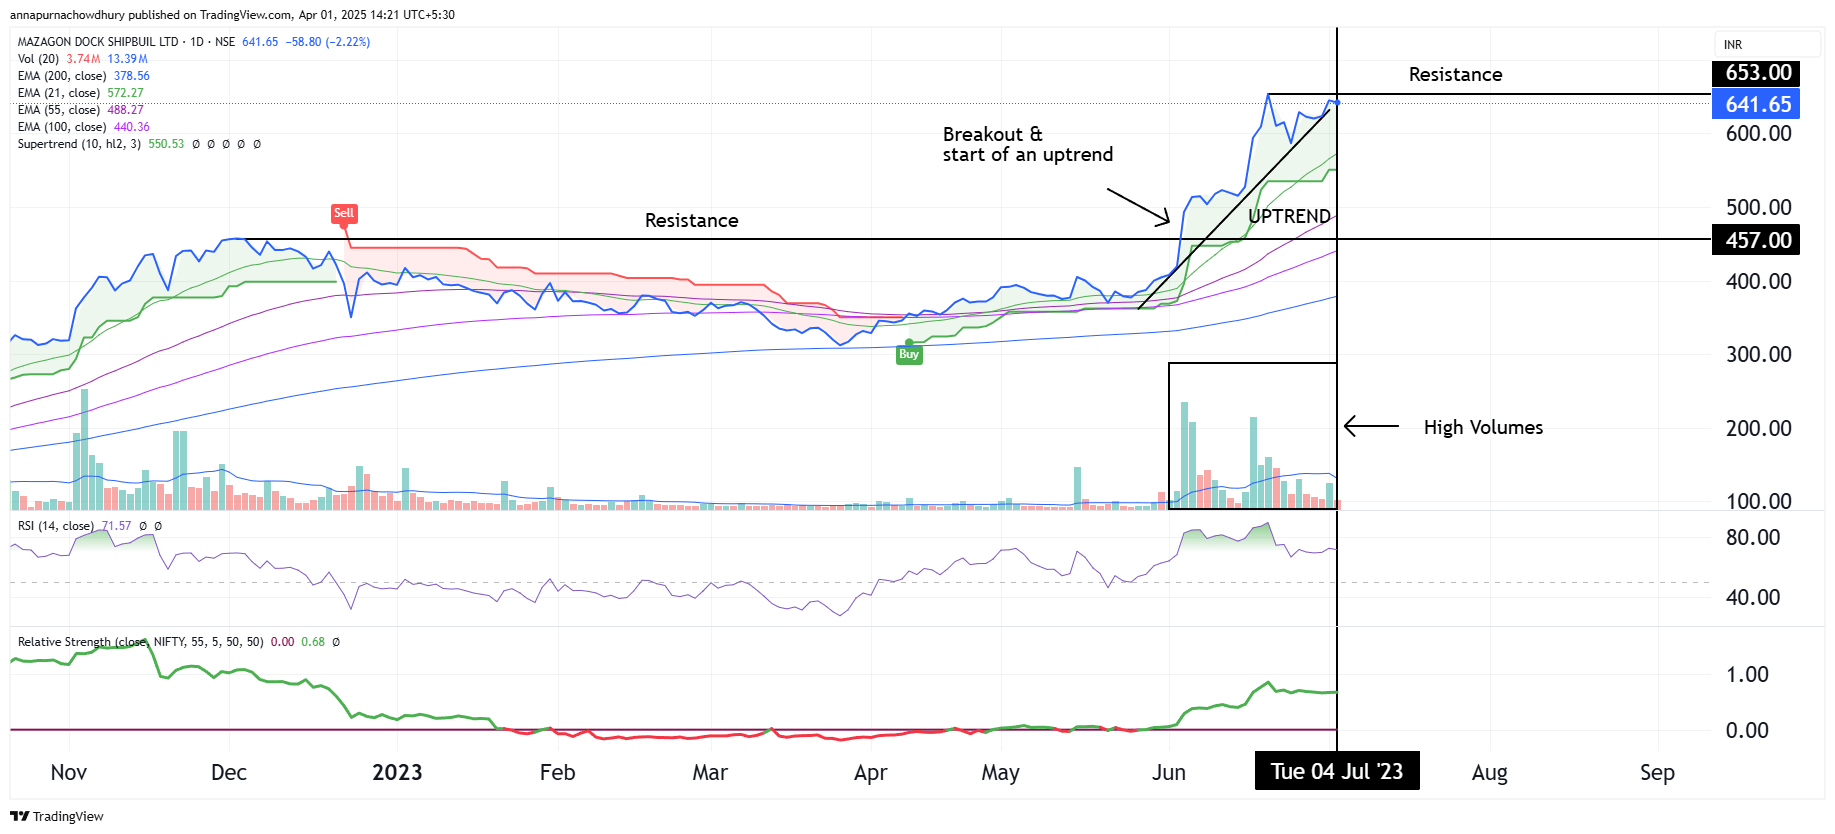
Figure 4.11
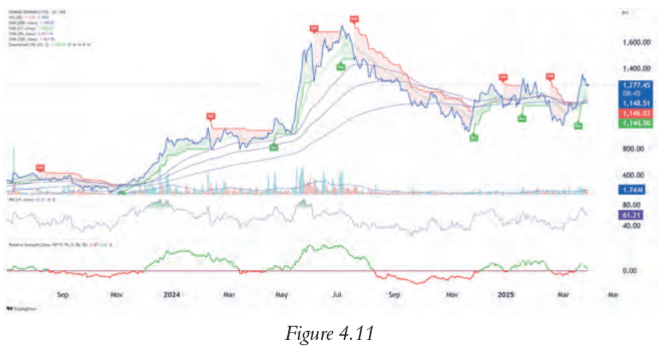
Figure 4.12
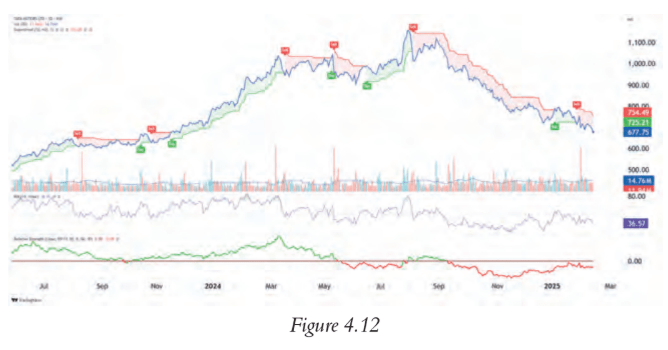
Figure 4.13
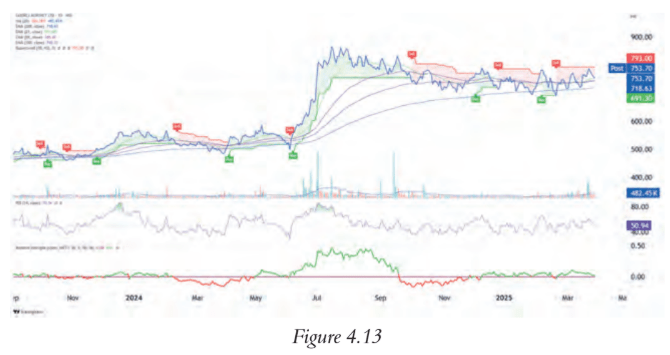
Figure 4.14
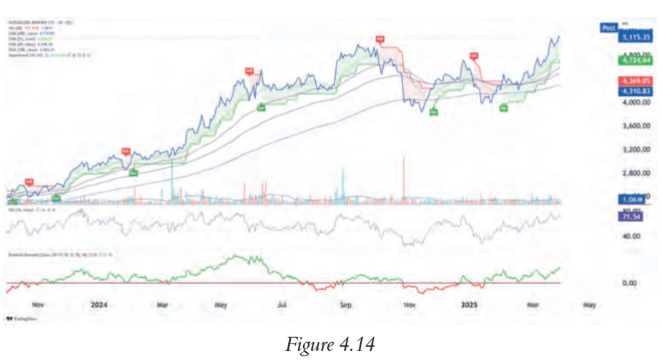
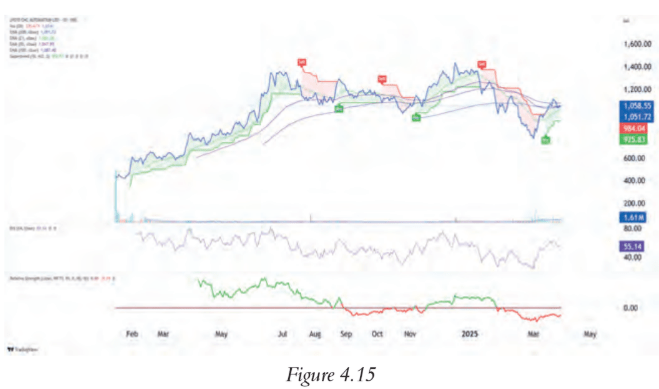
Figure 4.15