Figure 5.54 Daily chart of Nifty 50, USDINR and Dollar Index
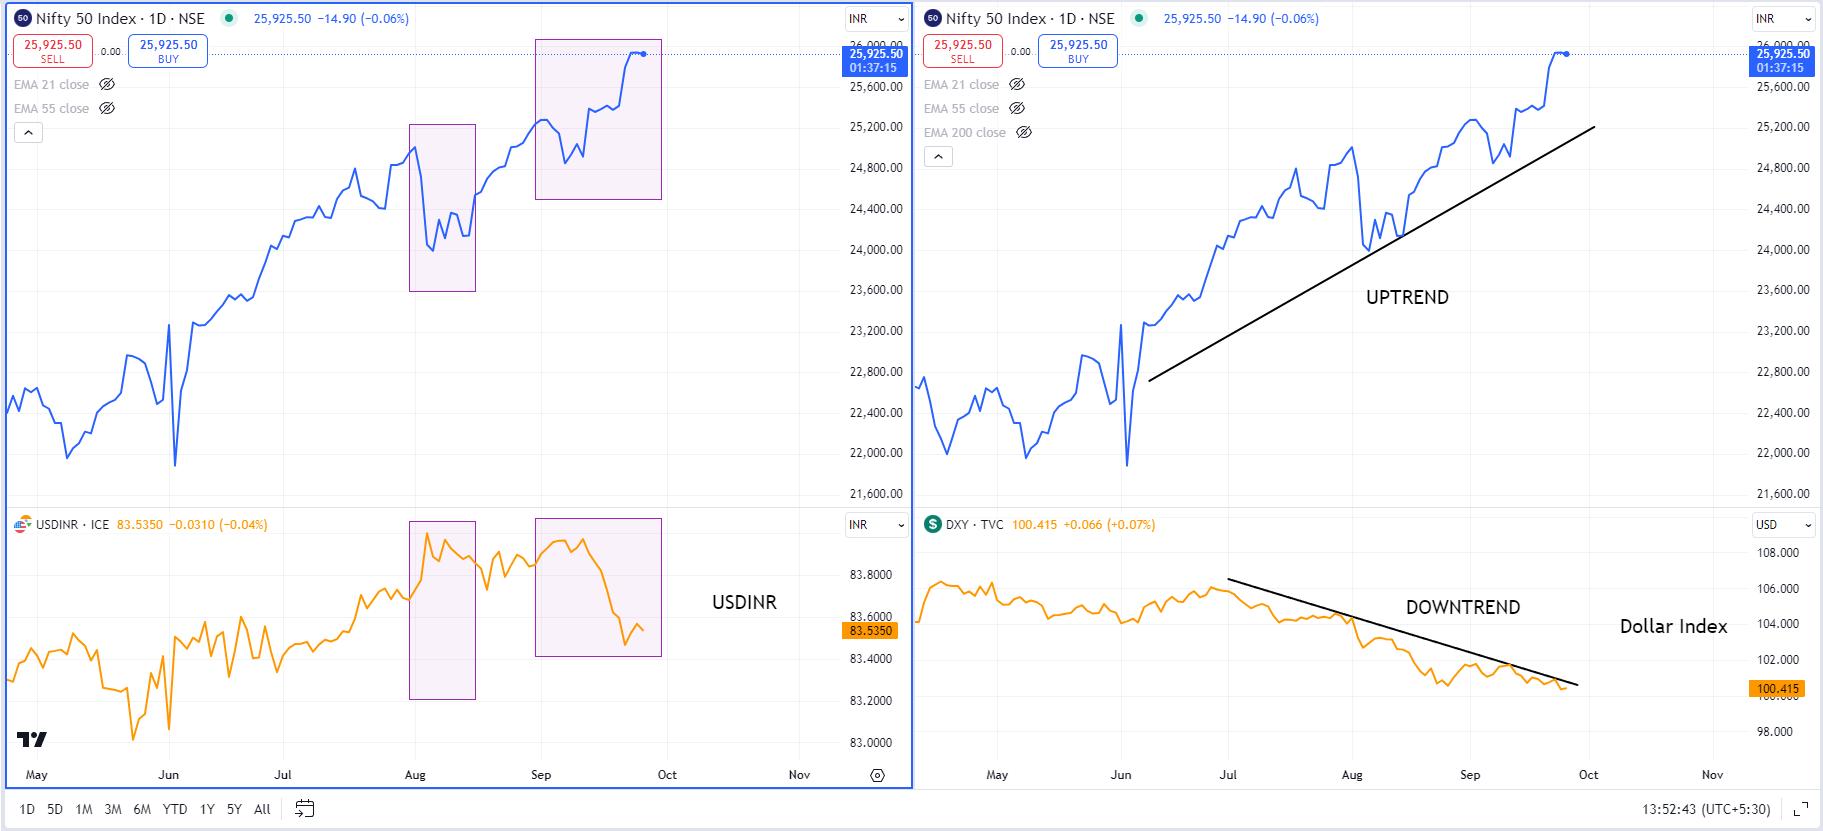
Figure 5.55 Daily chart of Nifty50, NASDAQ and S&P 500
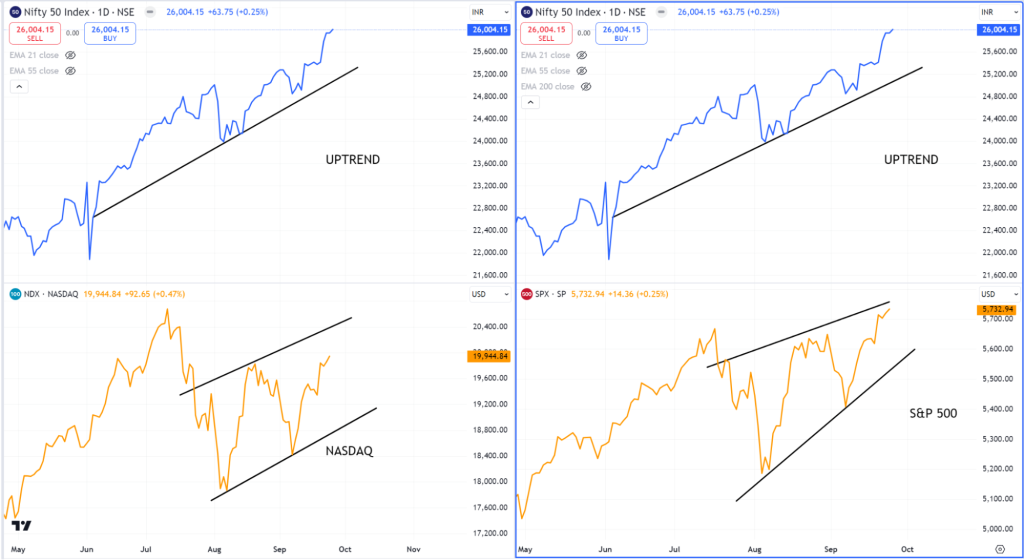
Figure 5.56 Daily chart of Nifty50 and Emerging Markets Index
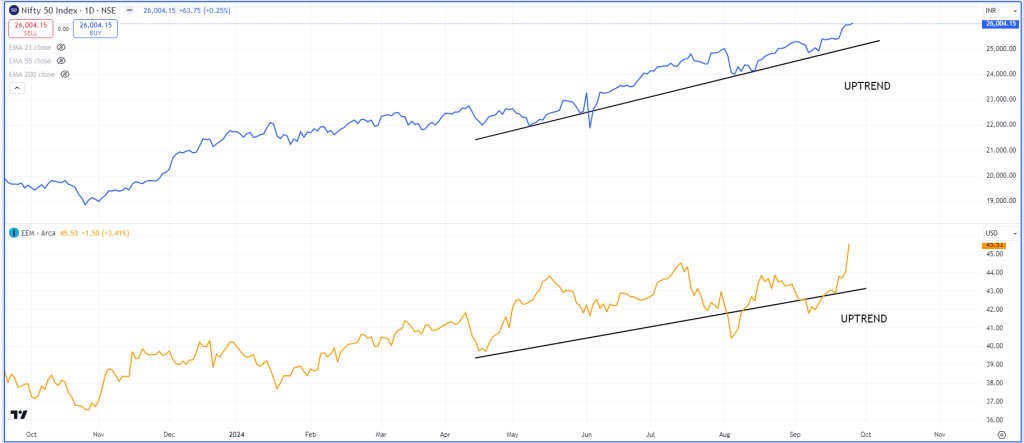
Figure 5.57 Daily chart of Nifty50, the US ten-year Bond Yield, and India ten-year Govt. Bond Yield
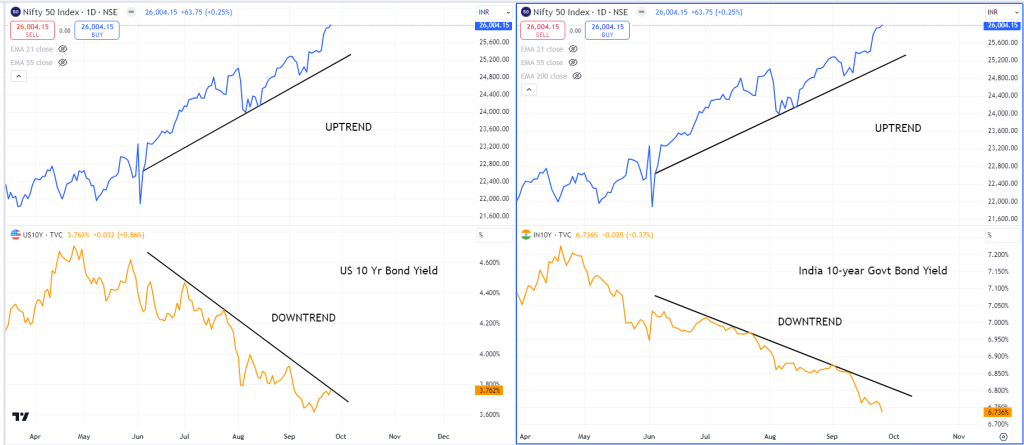
Figure 5.58 Daily chart of Dollar Index and Gold
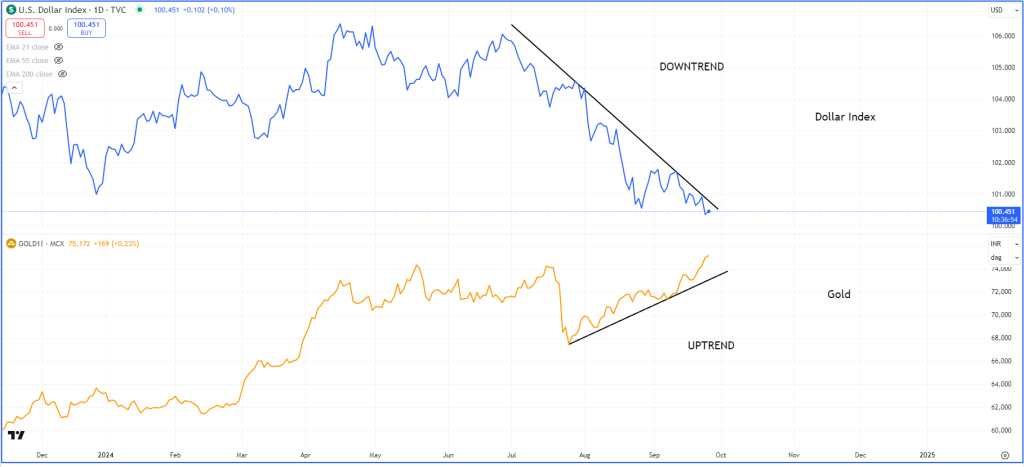
Figure 5.59 Summary of the macro markets and its impact on Nifty
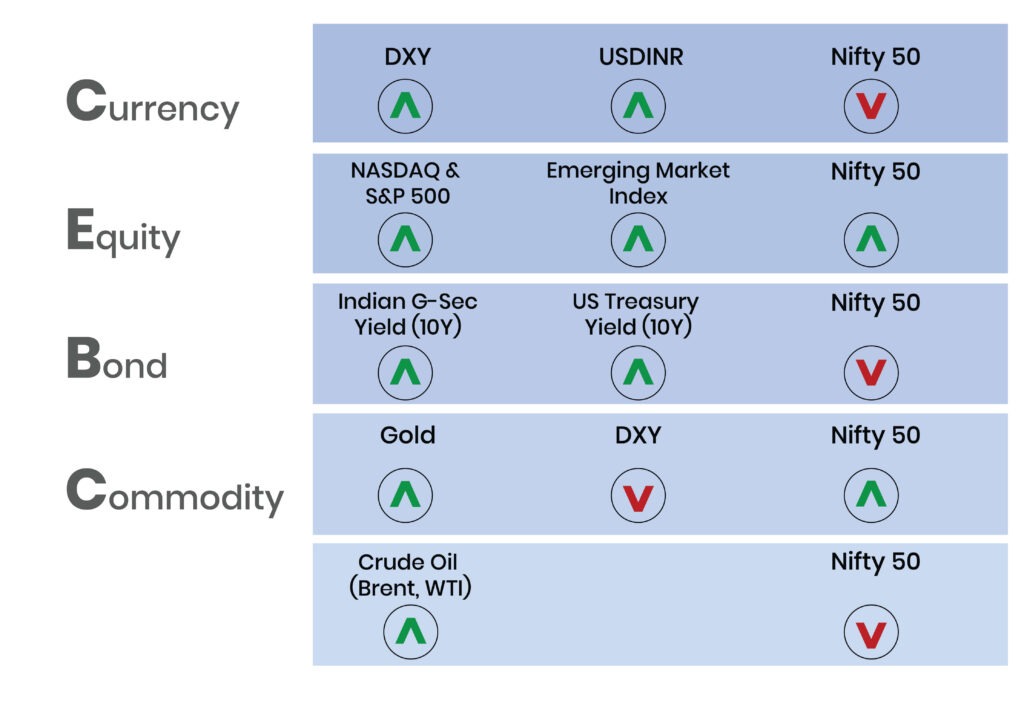
Figure 5.60
Figure 5.61
Tabe 5.9
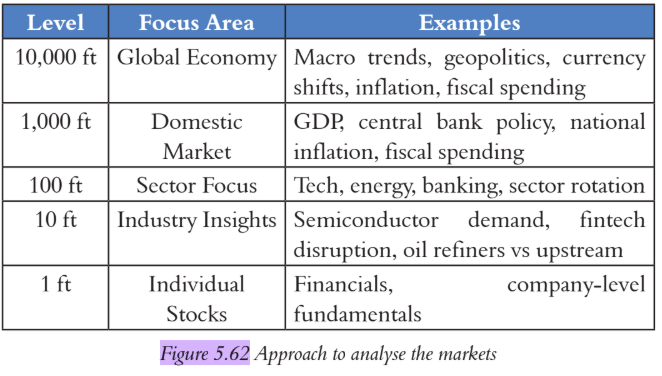
Figure 5.62 Approach to analyse the markets